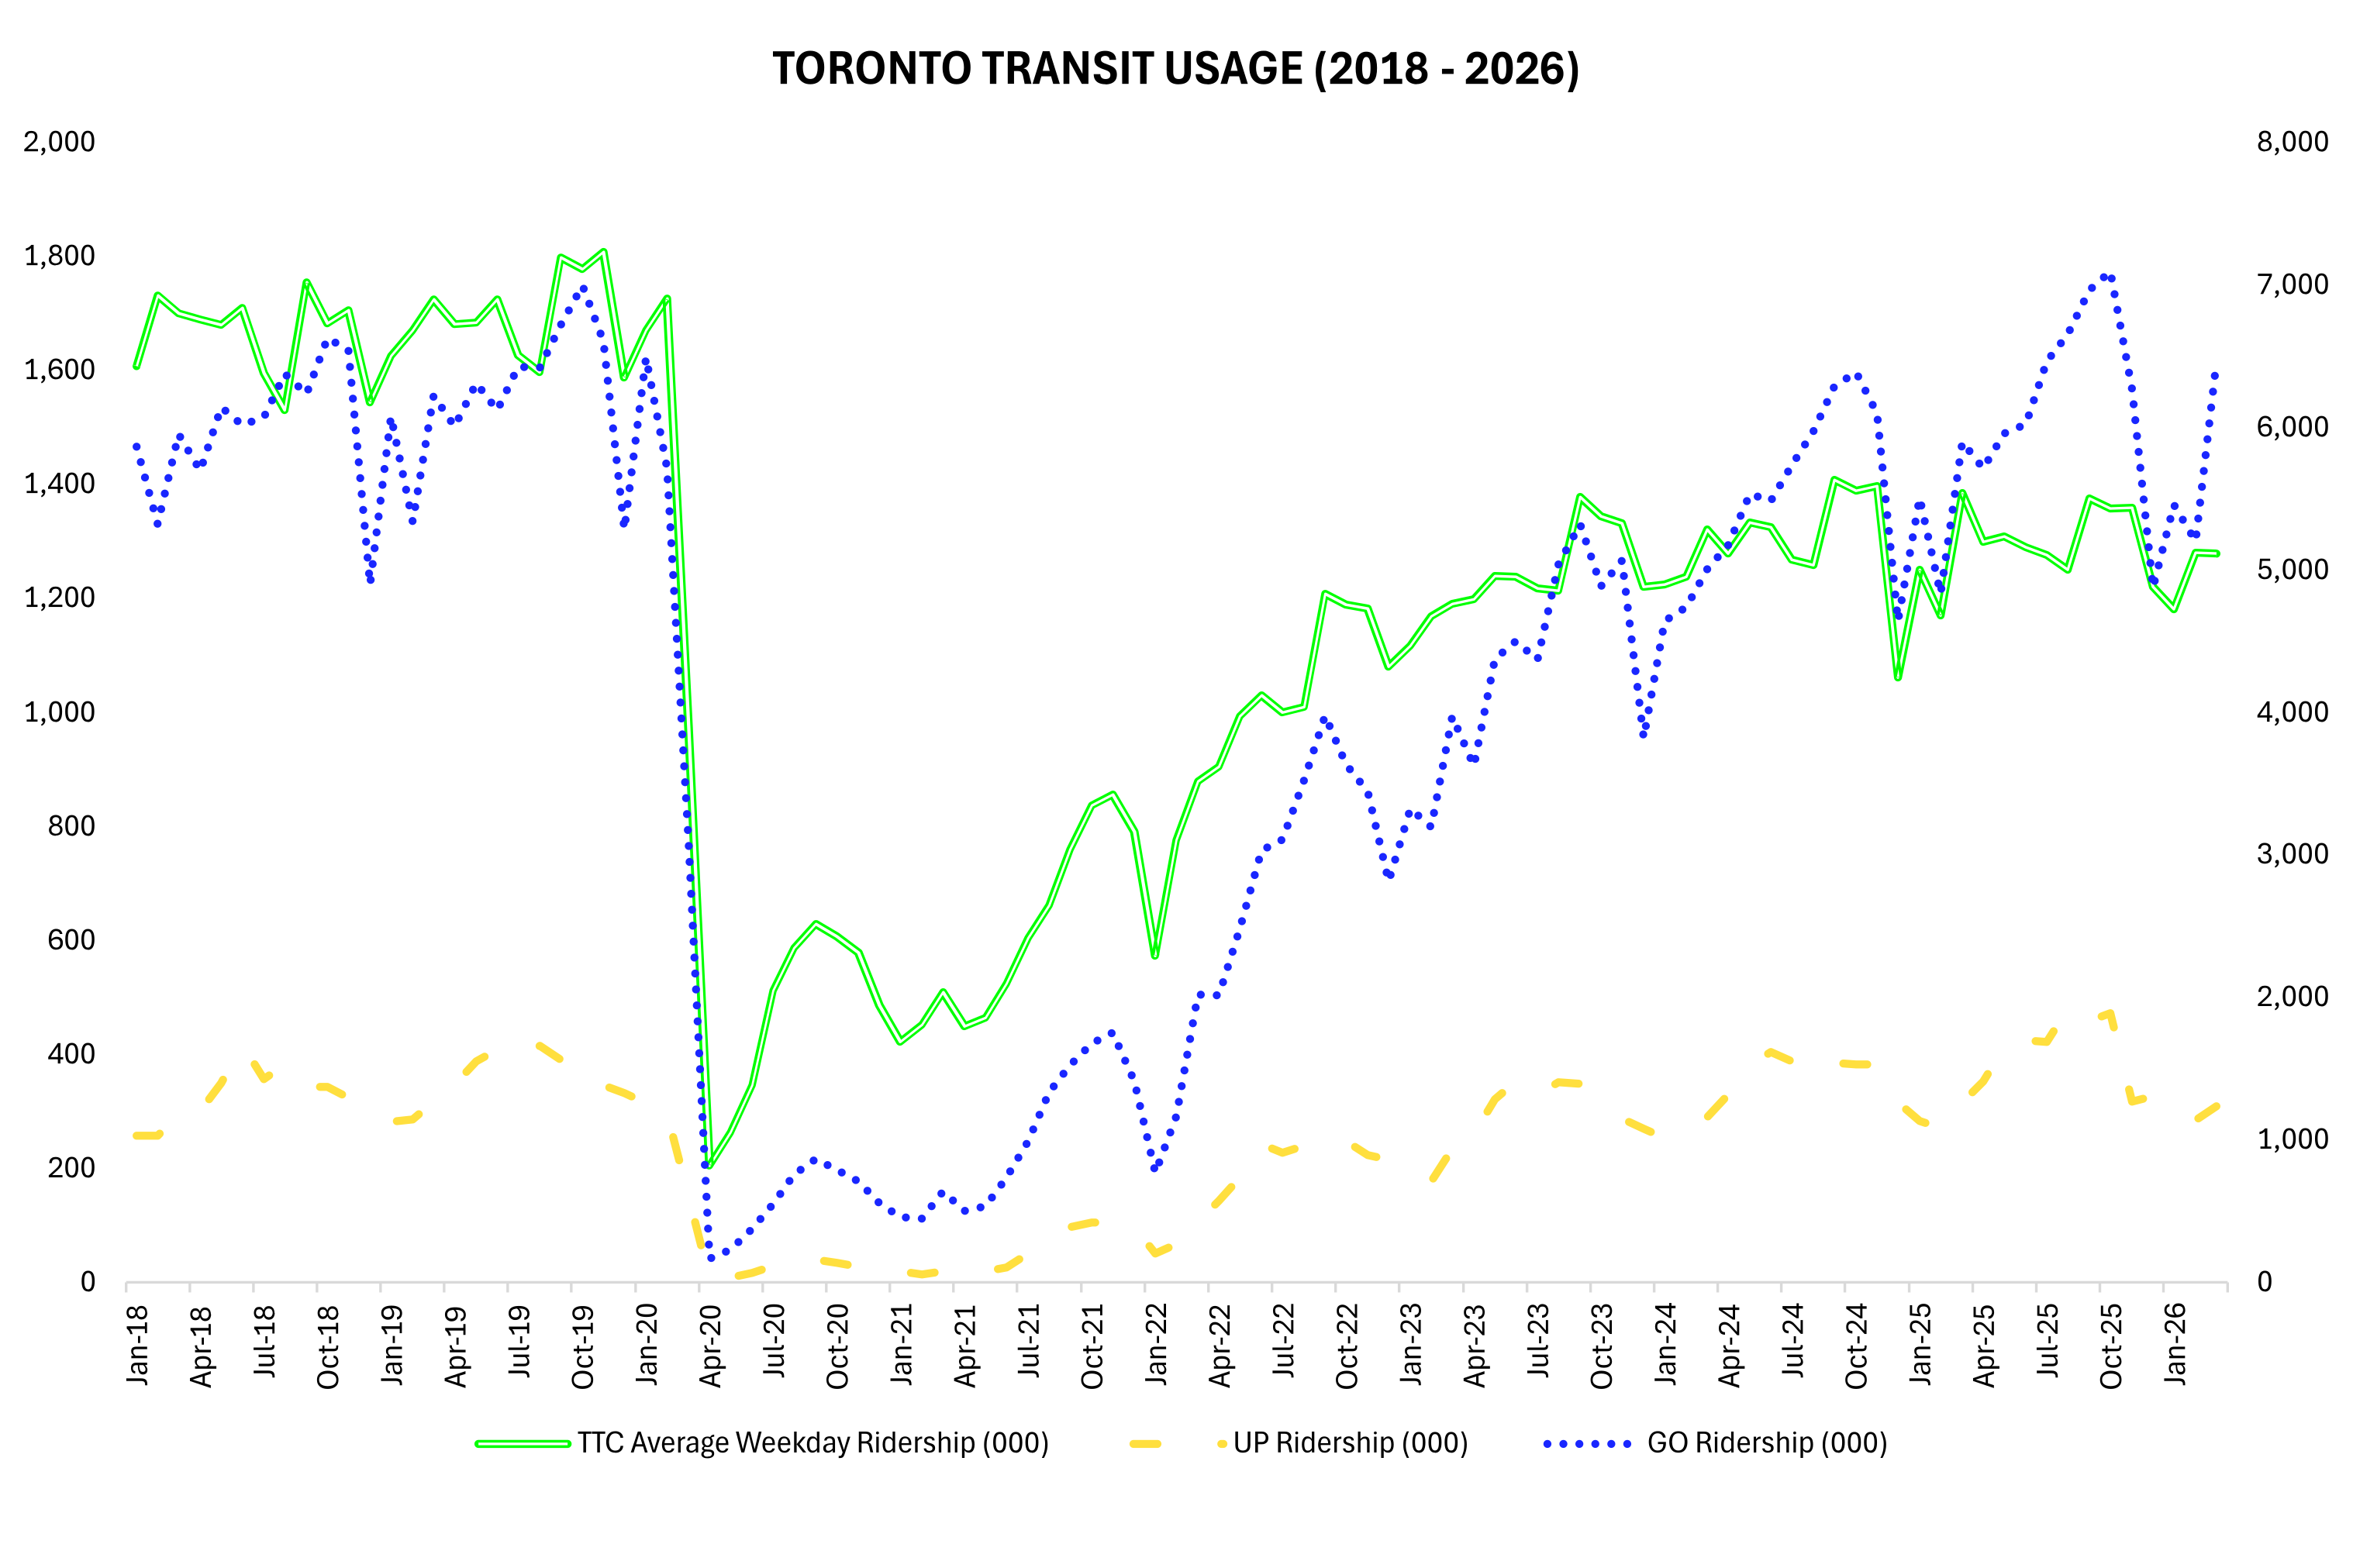
As GO Transit continues to expand its network, including the launch of new service to Stratford today, this chart shows transit usage in the Toronto region over the past eight years. TTC (red) represents average weekday ridership by month, while GO Transit (green) and UP Express (blue bars) show total monthly ridership.
The impact of COVID is clear and immediate. The recovery, however, has been much more gradual. While GO Transit and the UP Express have fully recovered (the average monthly ridership for GO over the past 12 months matches its pre-COVID average, while UP Express now exceeds pre-pandemic levels), the same cannot be said of the TTC.
Prior to COVID, the TTC averaged roughly 1.7 million rides per weekday. During the last 12 months reported (April 2025–March 2026), the TTC averaged about 1.3 million weekday rides.
While work-from-home and other factors have slowed the recovery of TTC ridership, GO Transit is not experiencing the same trend. Continued network expansion into communities such as Stratford reflects the growing demand for regional travel across Southern Ontario.
To be clear, the TTC still carries far more passengers overall; approximately 335 million weekday rides over the past 12 months compared with 73 million total rides on GO Transit.