Stats Canada Data Visualizations
Mahjabeen Mamoon
14 April 2025
Employment services, such as those offered through Employment Ontario (EO), can use Statistics Canada’s data visualizations to better understand and respond to local labor market trends. These visual tools make complex statistics easier to interpret, helping employment counselors, program planners, and job developers quickly identify patterns in areas like:
- Unemployment rates by region or demographic
- In-demand occupations and skills
- Shifts in industry employment
- Educational outcomes and workforce alignment
By simplifying large datasets and making trends visible at a glance, data visualizations allow EO service providers to tailor supports and programming more effectively. For instance, they might use a visualization on youth unemployment to guide targeted outreach, or a dashboard on sector growth to inform employer engagement and training initiatives. Ultimately, these tools help employment services align their efforts with real-world economic and social conditions, ensuring more relevant and timely interventions.
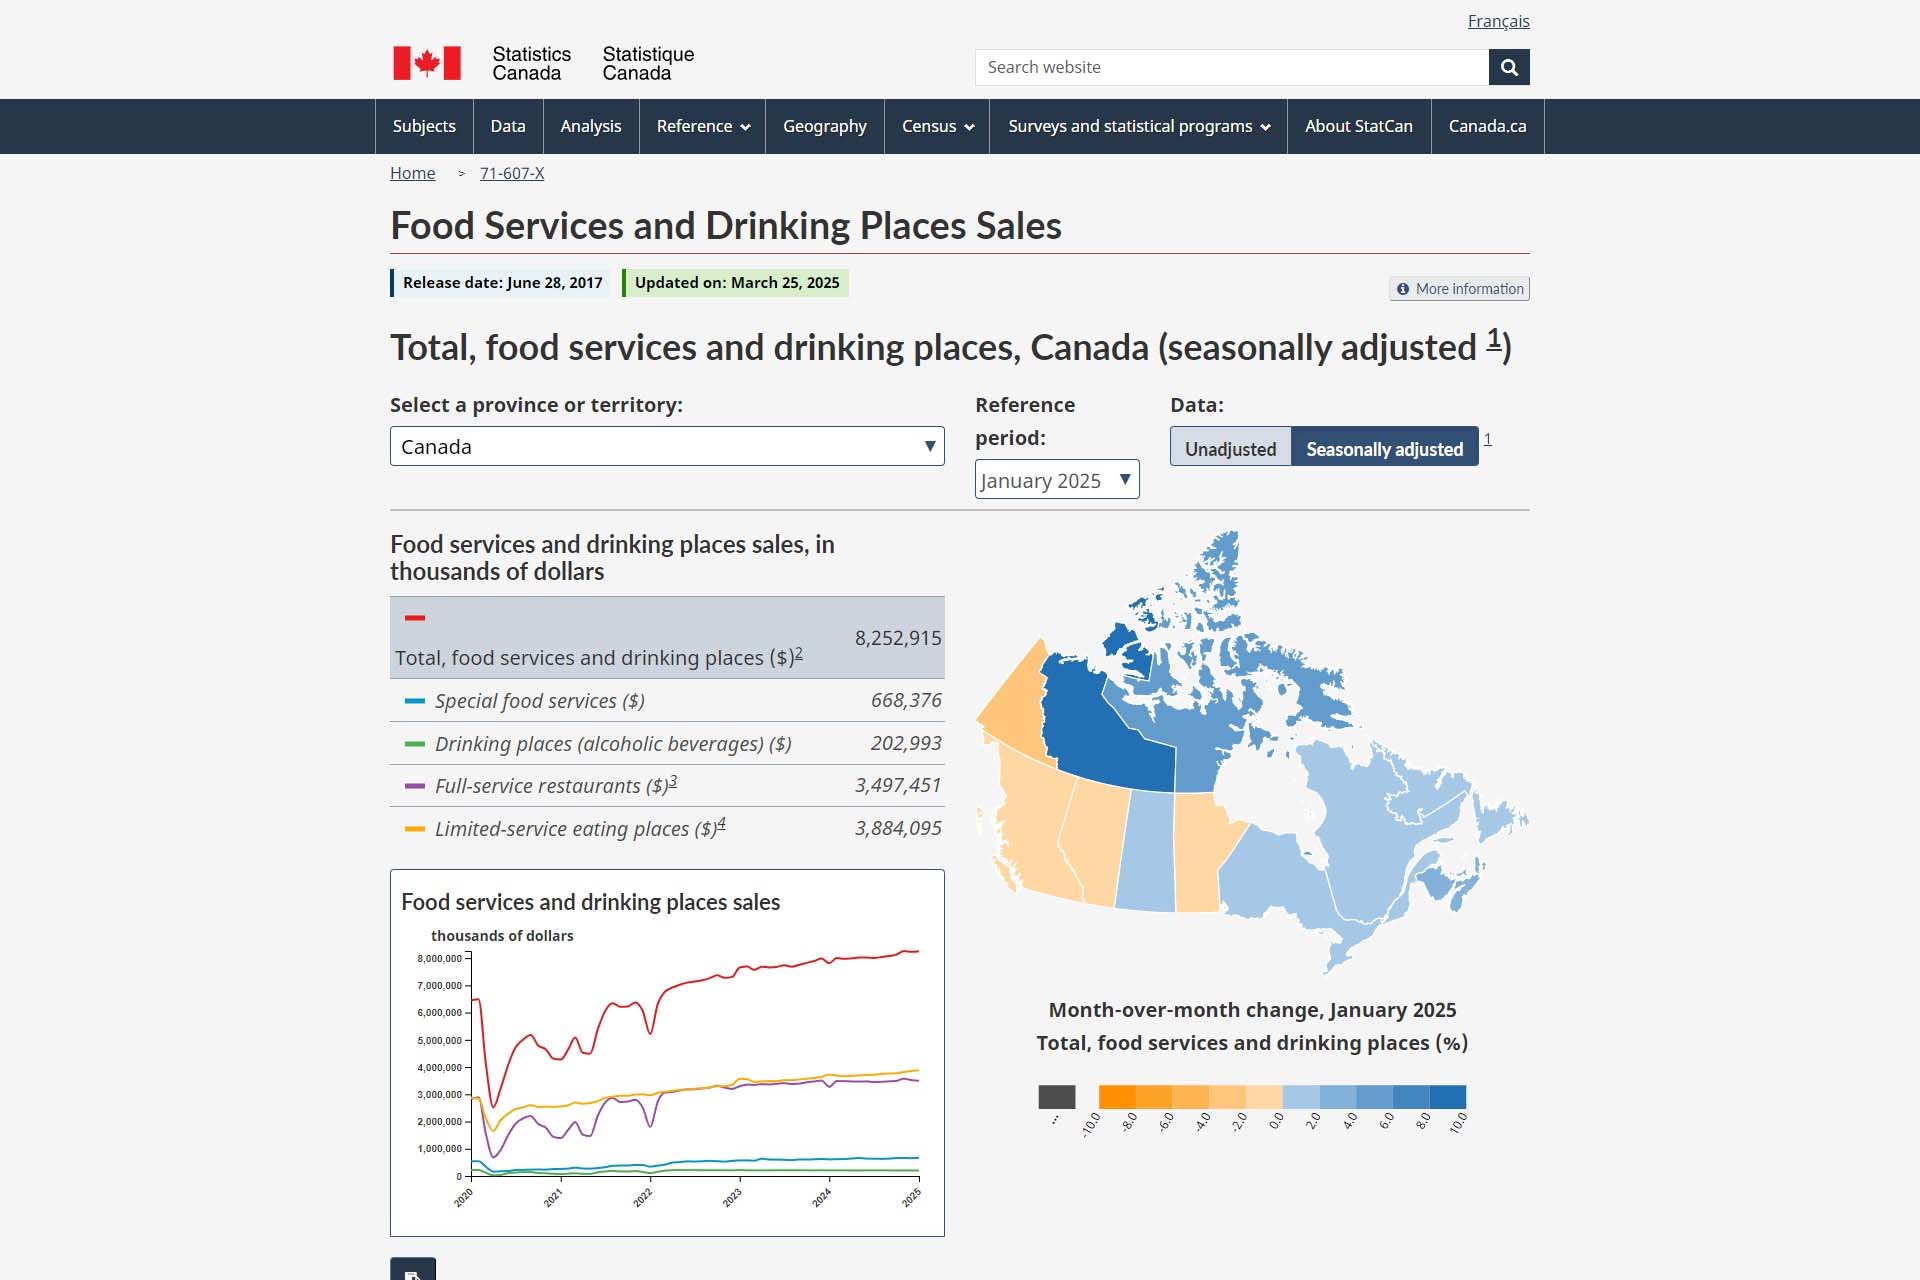
Food Services and Drinking Places Sales
The Statistics Canada data product on “Food Services and Drinking Places Sales” provides critical monthly updates on sales figures for the food service and bar sectors, expressed in current dollars and adjusted for seasonal variations. This information is crucial for understanding economic trends within these industries, helping businesses and policymakers make informed decisions. It also serves as a barometer for consumer spending and economic health in the hospitality sector.
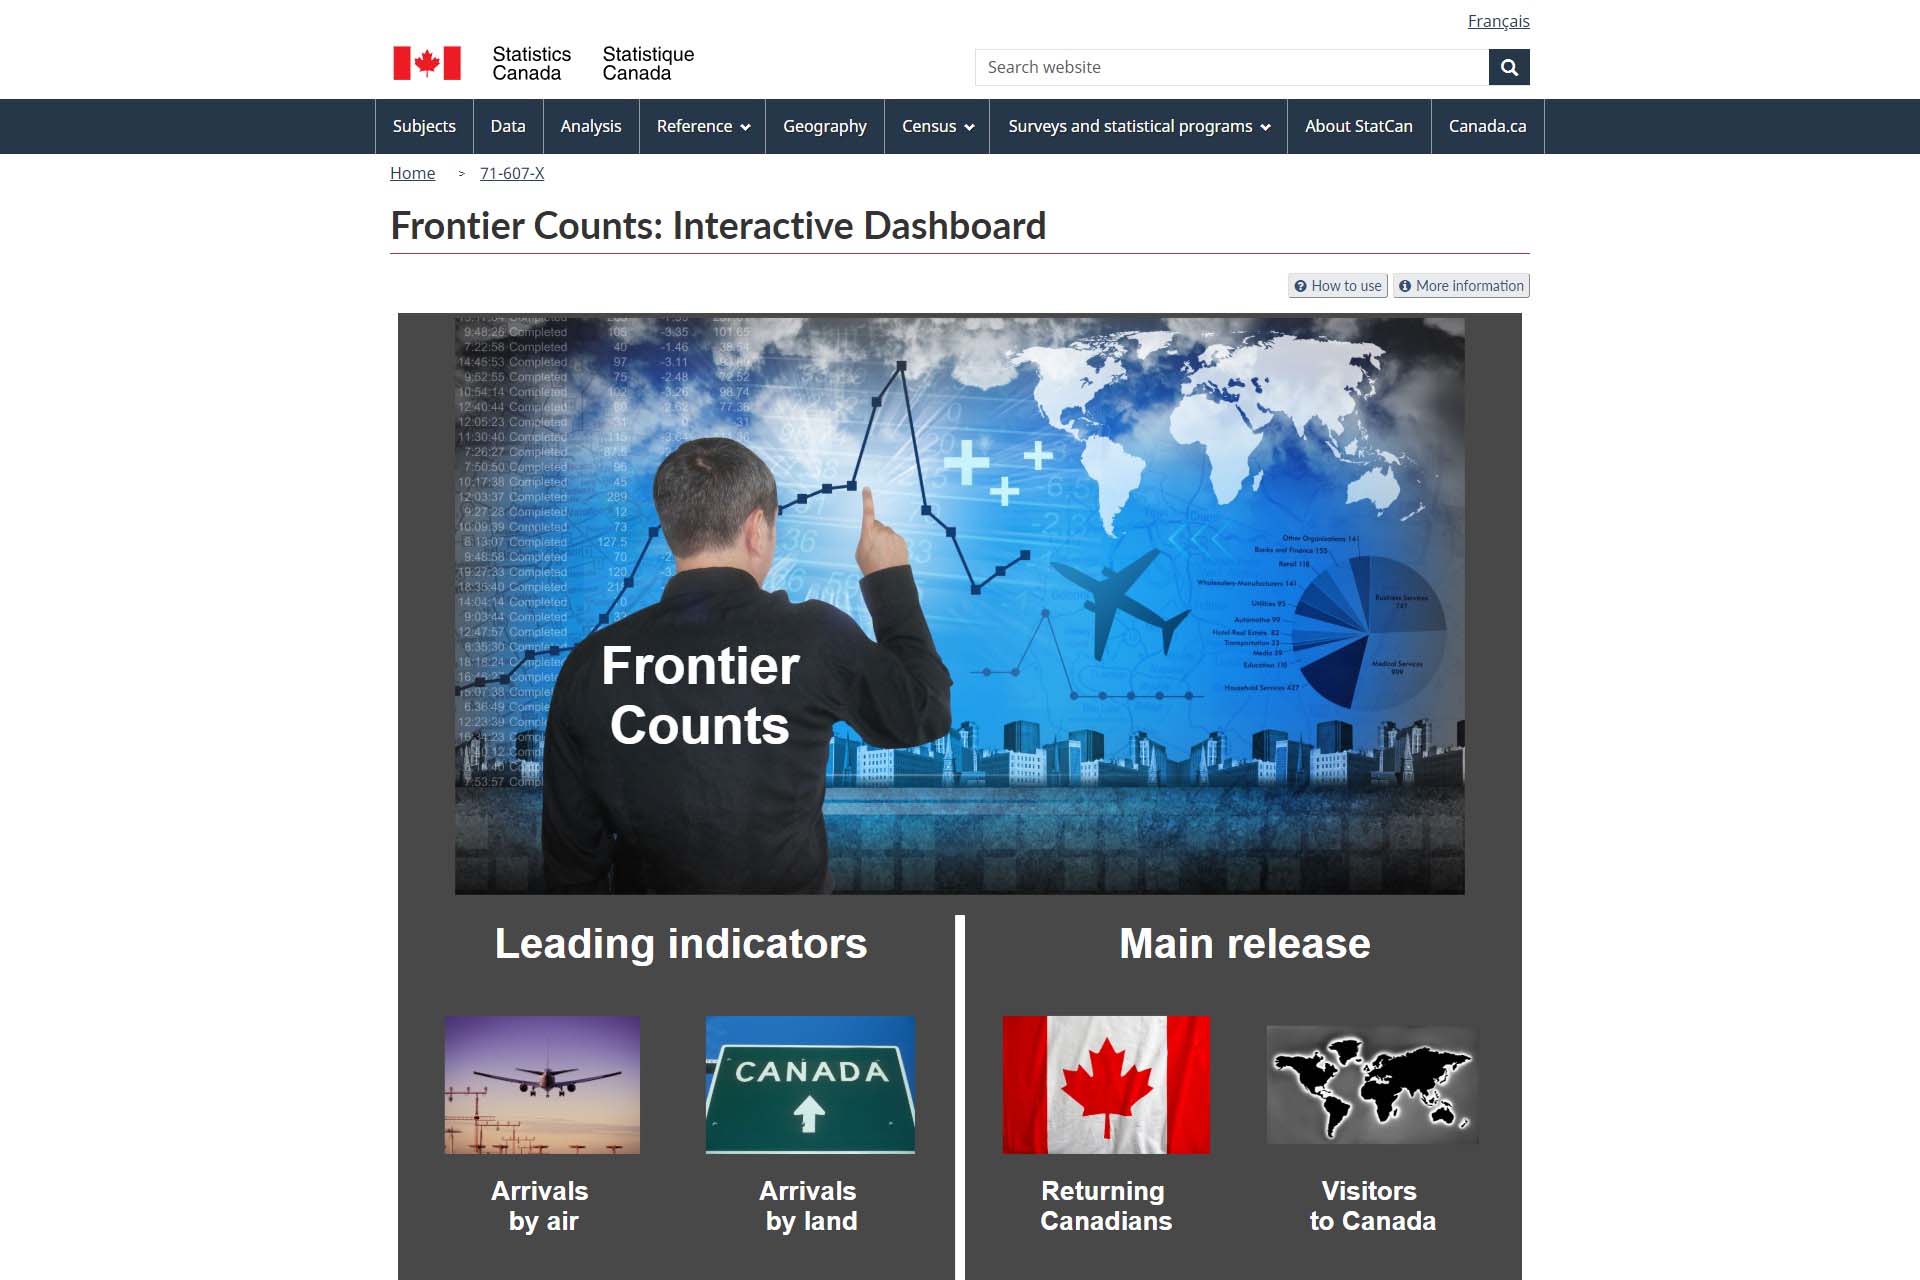
Frontier Counts: Interactive Dashboard
The “Frontier Counts: Interactive Dashboard” provided by Statistics Canada is an essential tool that delivers real-time data on the movements of international visitors and Canadian residents through air and land ports. This dashboard is vital for tourism and border management sectors as it helps monitor and analyze travel trends, visitor volumes, and the economic impact of tourism in Canada. By enabling customized views of data over the last five years, it assists policymakers, businesses, and researchers in making informed decisions based on up-to-date border crossing statistics.
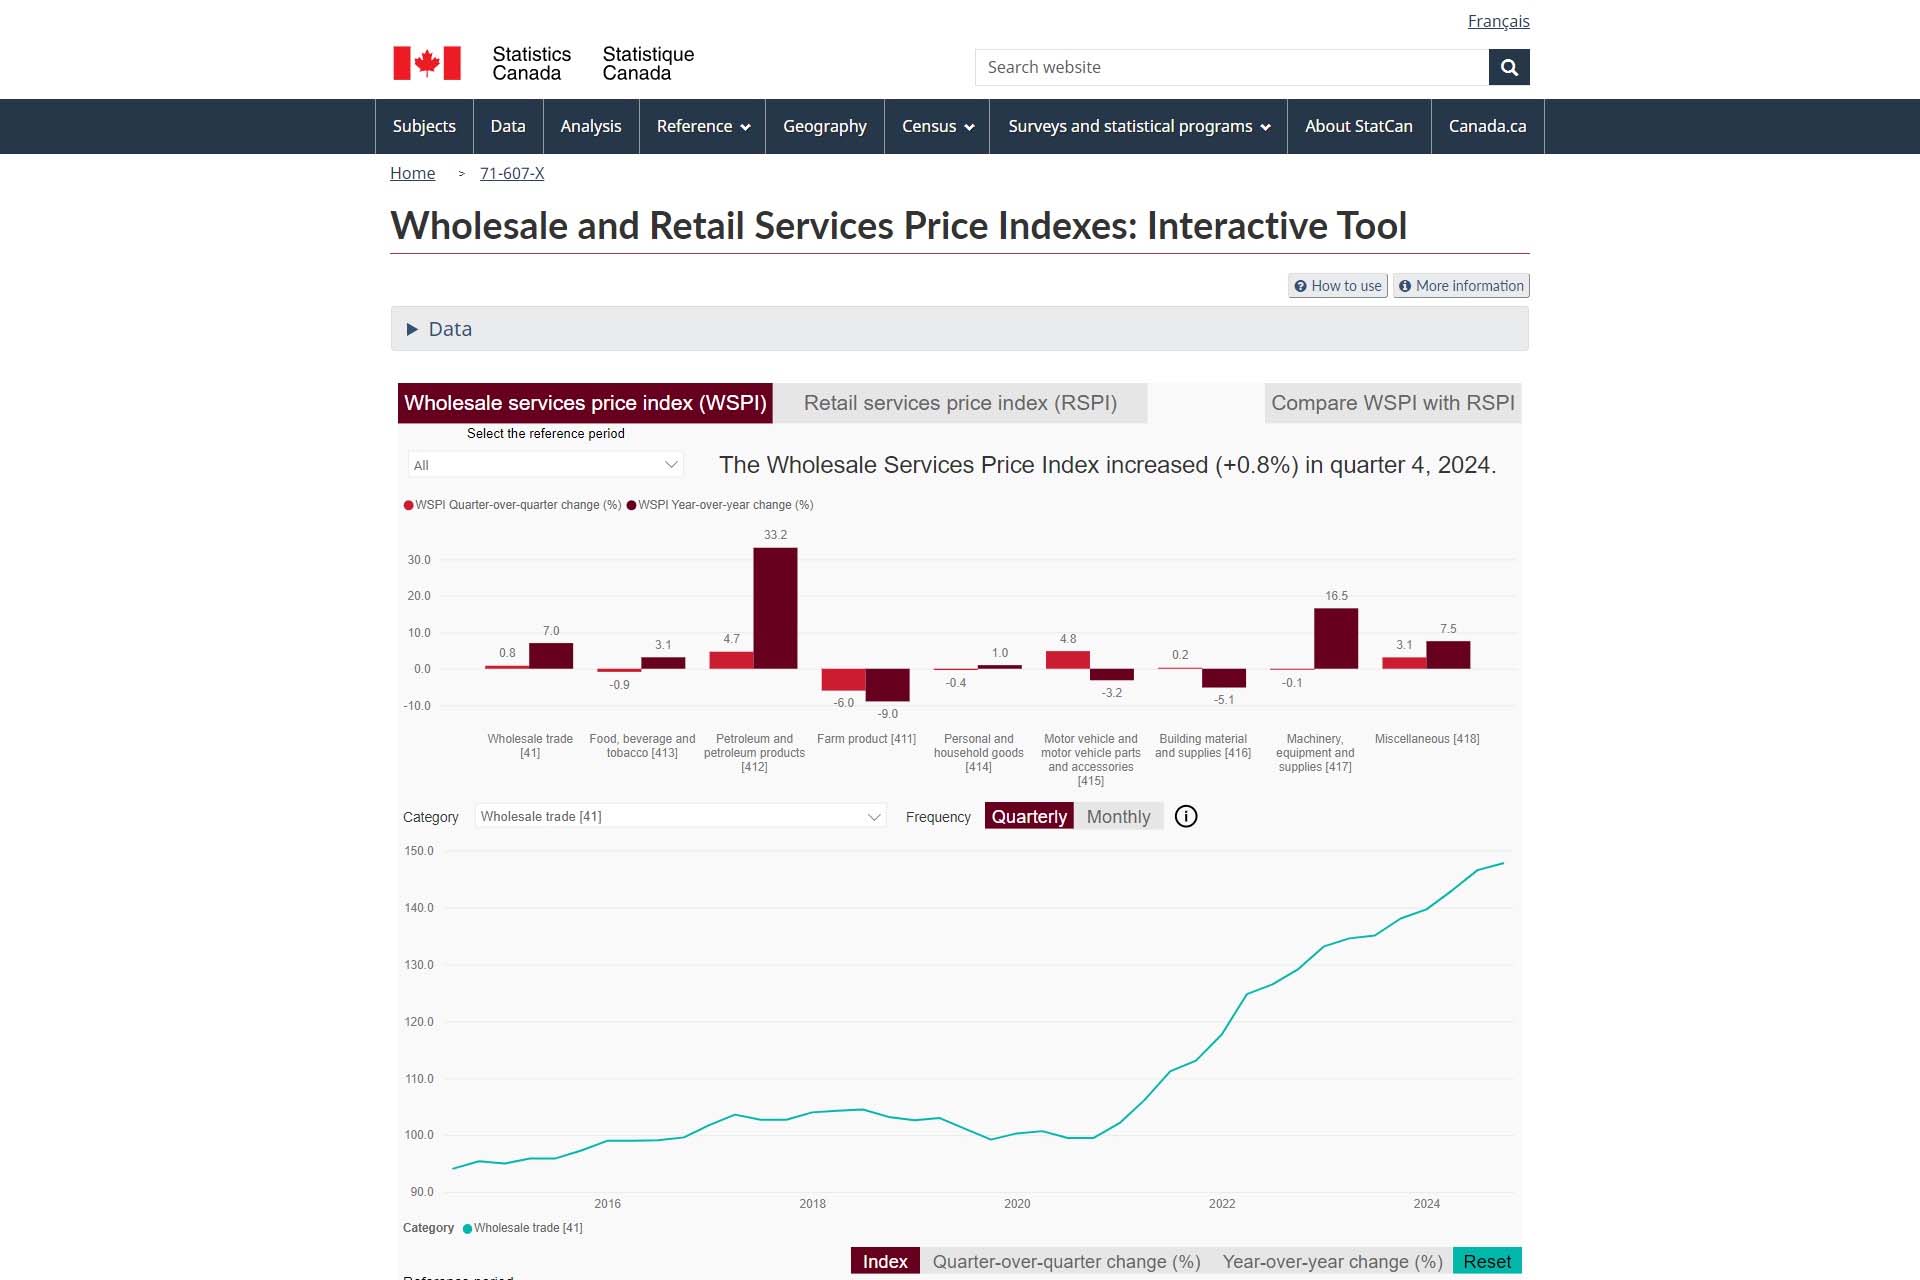
Wholesale and Retail Services Price Indexes: Interactive Tool
The “Wholesale and Retail Services Price Indexes: Interactive Tool” from Statistics Canada offers a dynamic way to explore the changes in service prices within the wholesale and retail sectors. This tool is essential for understanding the economic factors affecting these sectors, providing a clear view of pricing trends and margins over time. By utilizing this interactive dashboard, businesses, economists, and policymakers can make better-informed decisions based on up-to-date data reflecting the economic realities of the marketplace.
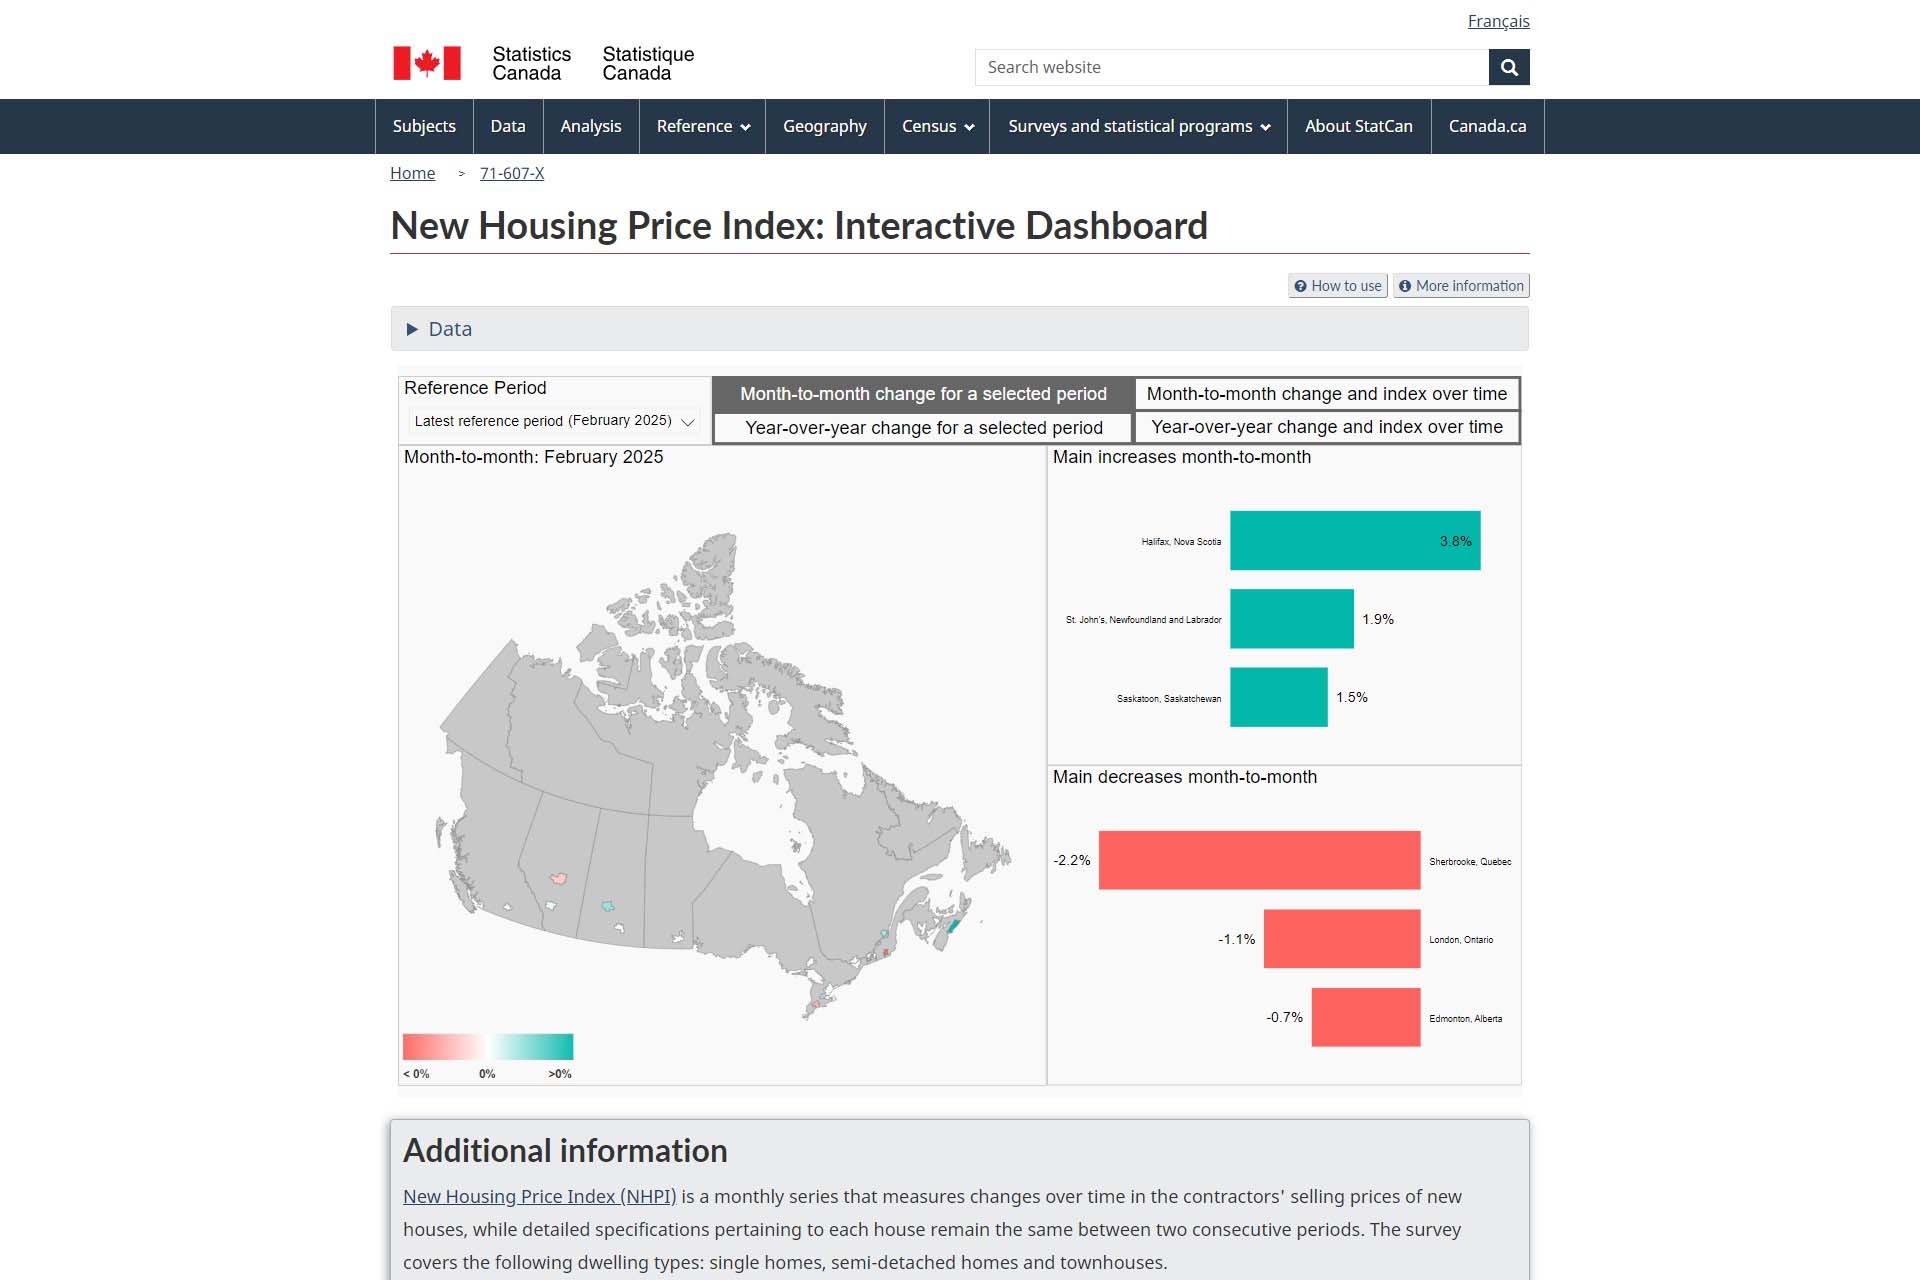
New Housing Price Index: Interactive Dashboard
The “New Housing Price Index: Interactive Dashboard” from Statistics Canada is a crucial tool for tracking changes in the selling prices of new residential houses over time, ensuring specifications remain constant. This index is particularly significant for industry stakeholders, including builders, buyers, economists, and policymakers, as it provides insights into housing market trends and economic conditions affecting the real estate sector. The interactive features allow for detailed analysis of data by geographical location and time, enhancing usability for strategic planning and market assessment.
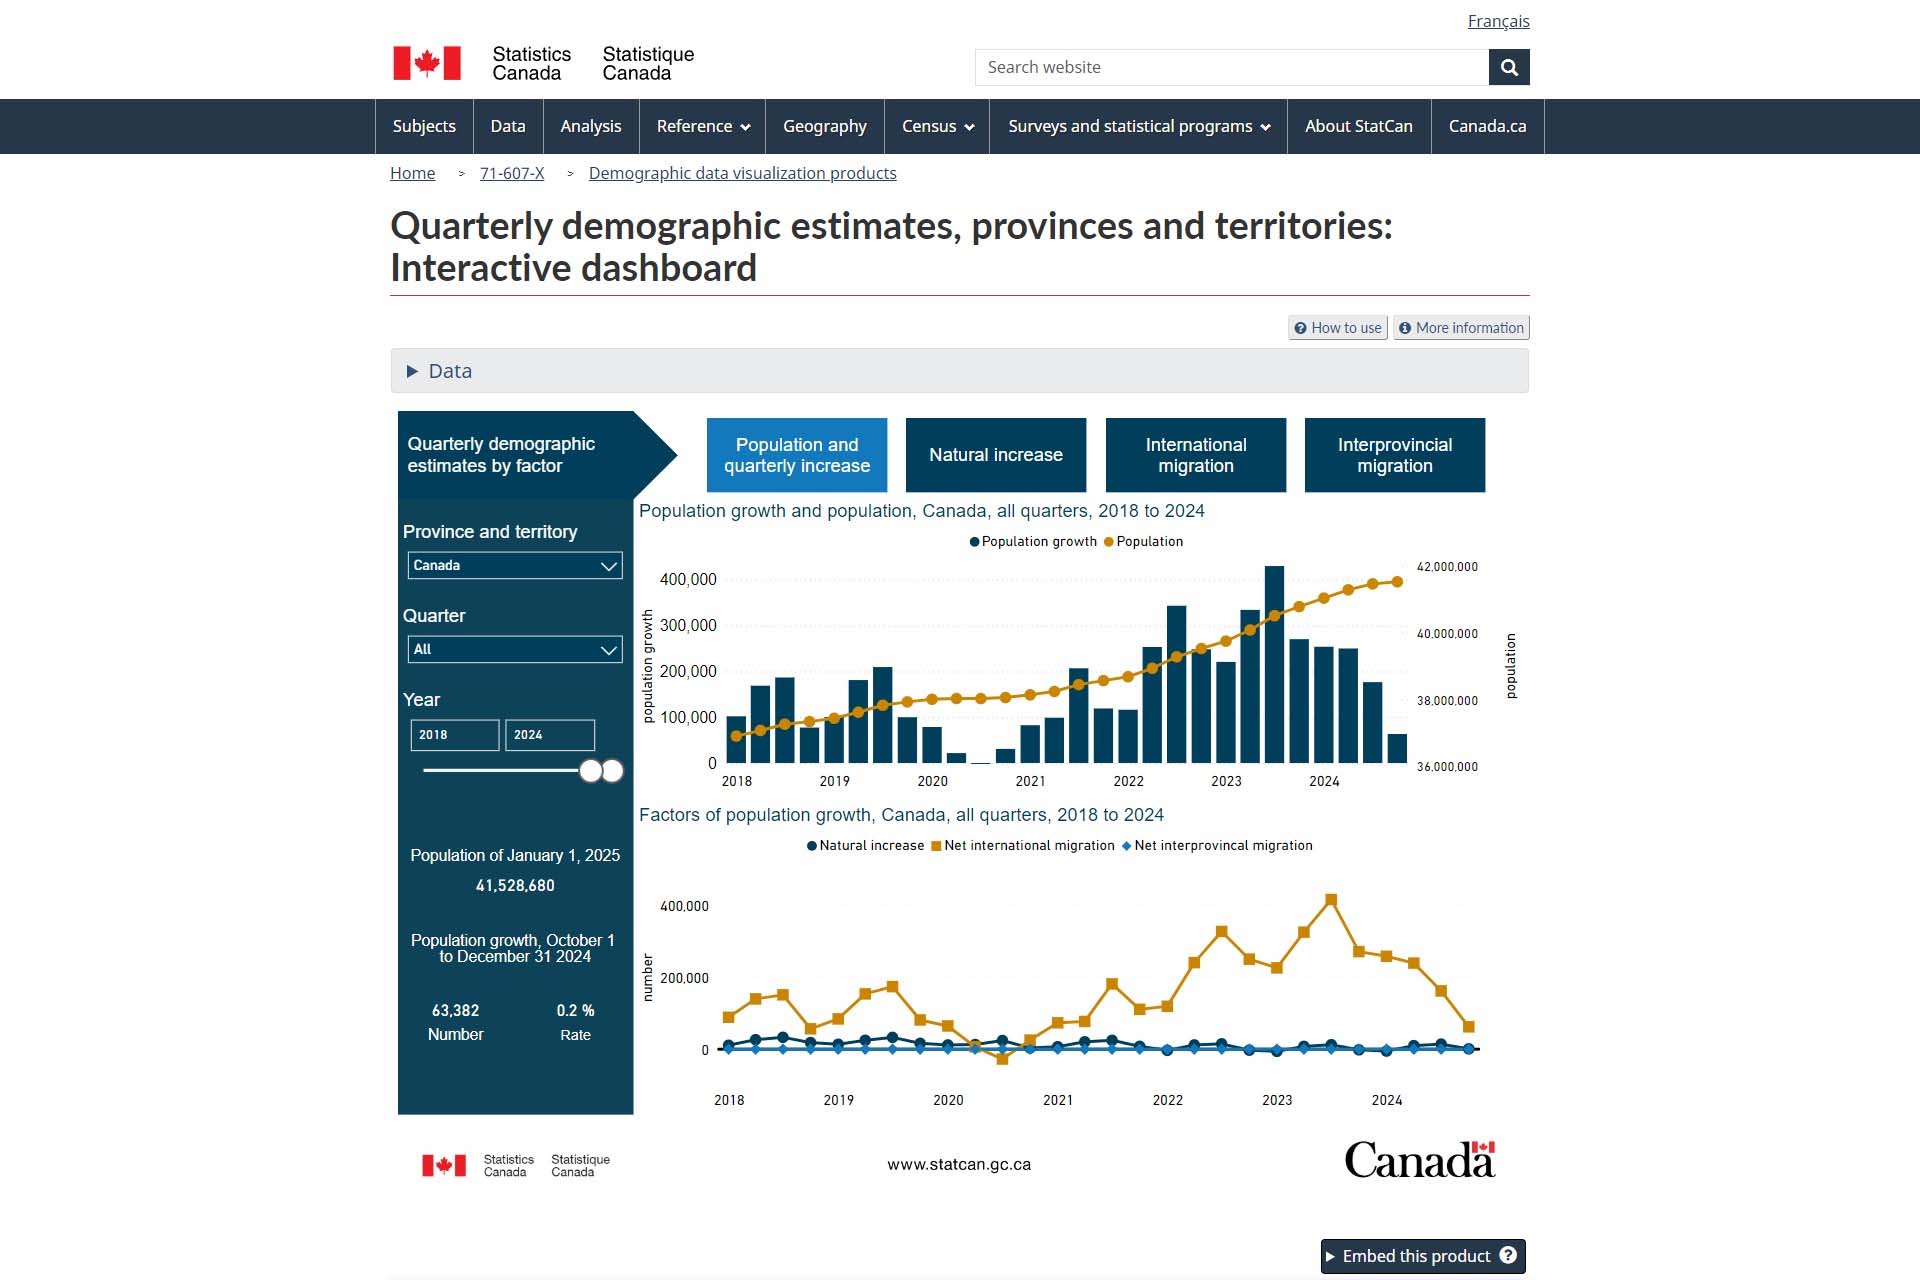
Quarterly demographic estimates, provinces and territories: Interactive dashboard
The “Quarterly Demographic Estimates” interactive dashboard from Statistics Canada provides invaluable data on population changes in Canada’s provinces and territories, including natural increase, net migration, and demographic growth rates. This tool is vital for government planners, policymakers, and researchers who need to track demographic trends and forecast future changes, aiding in resource allocation and policy development.
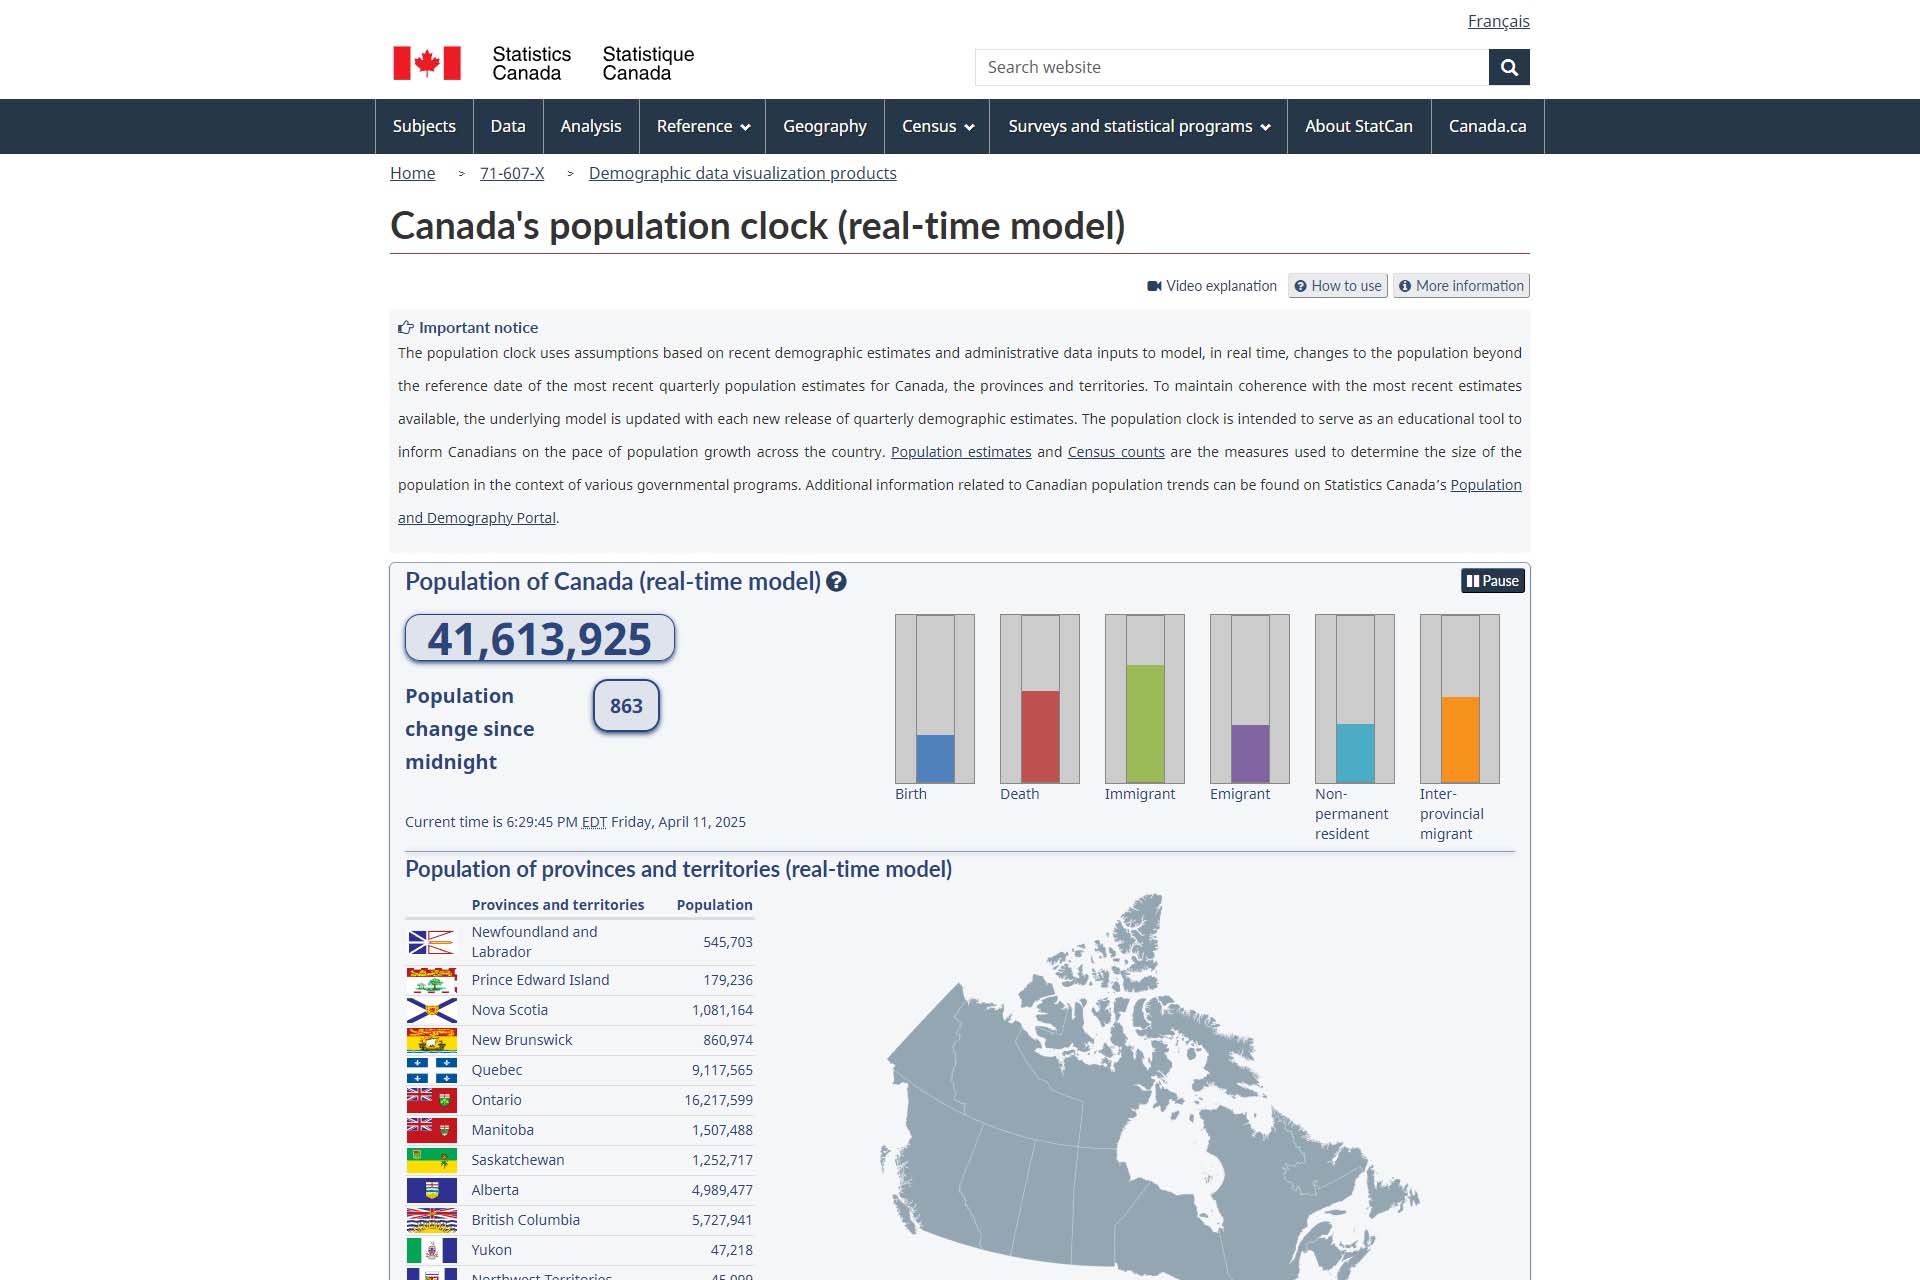
Canada’s population clock (real-time model)
Canada’s Population Clock, provided by Statistics Canada, is a real-time model that tracks changes in the population of Canada, its provinces, and territories. This tool is crucial for understanding the pace of population growth through live updates on births, deaths, immigration, and more. It serves as an invaluable resource for policymakers, demographers, and the public to observe and analyze population trends as they happen, aiding in responsive decision-making and planning across various sectors.
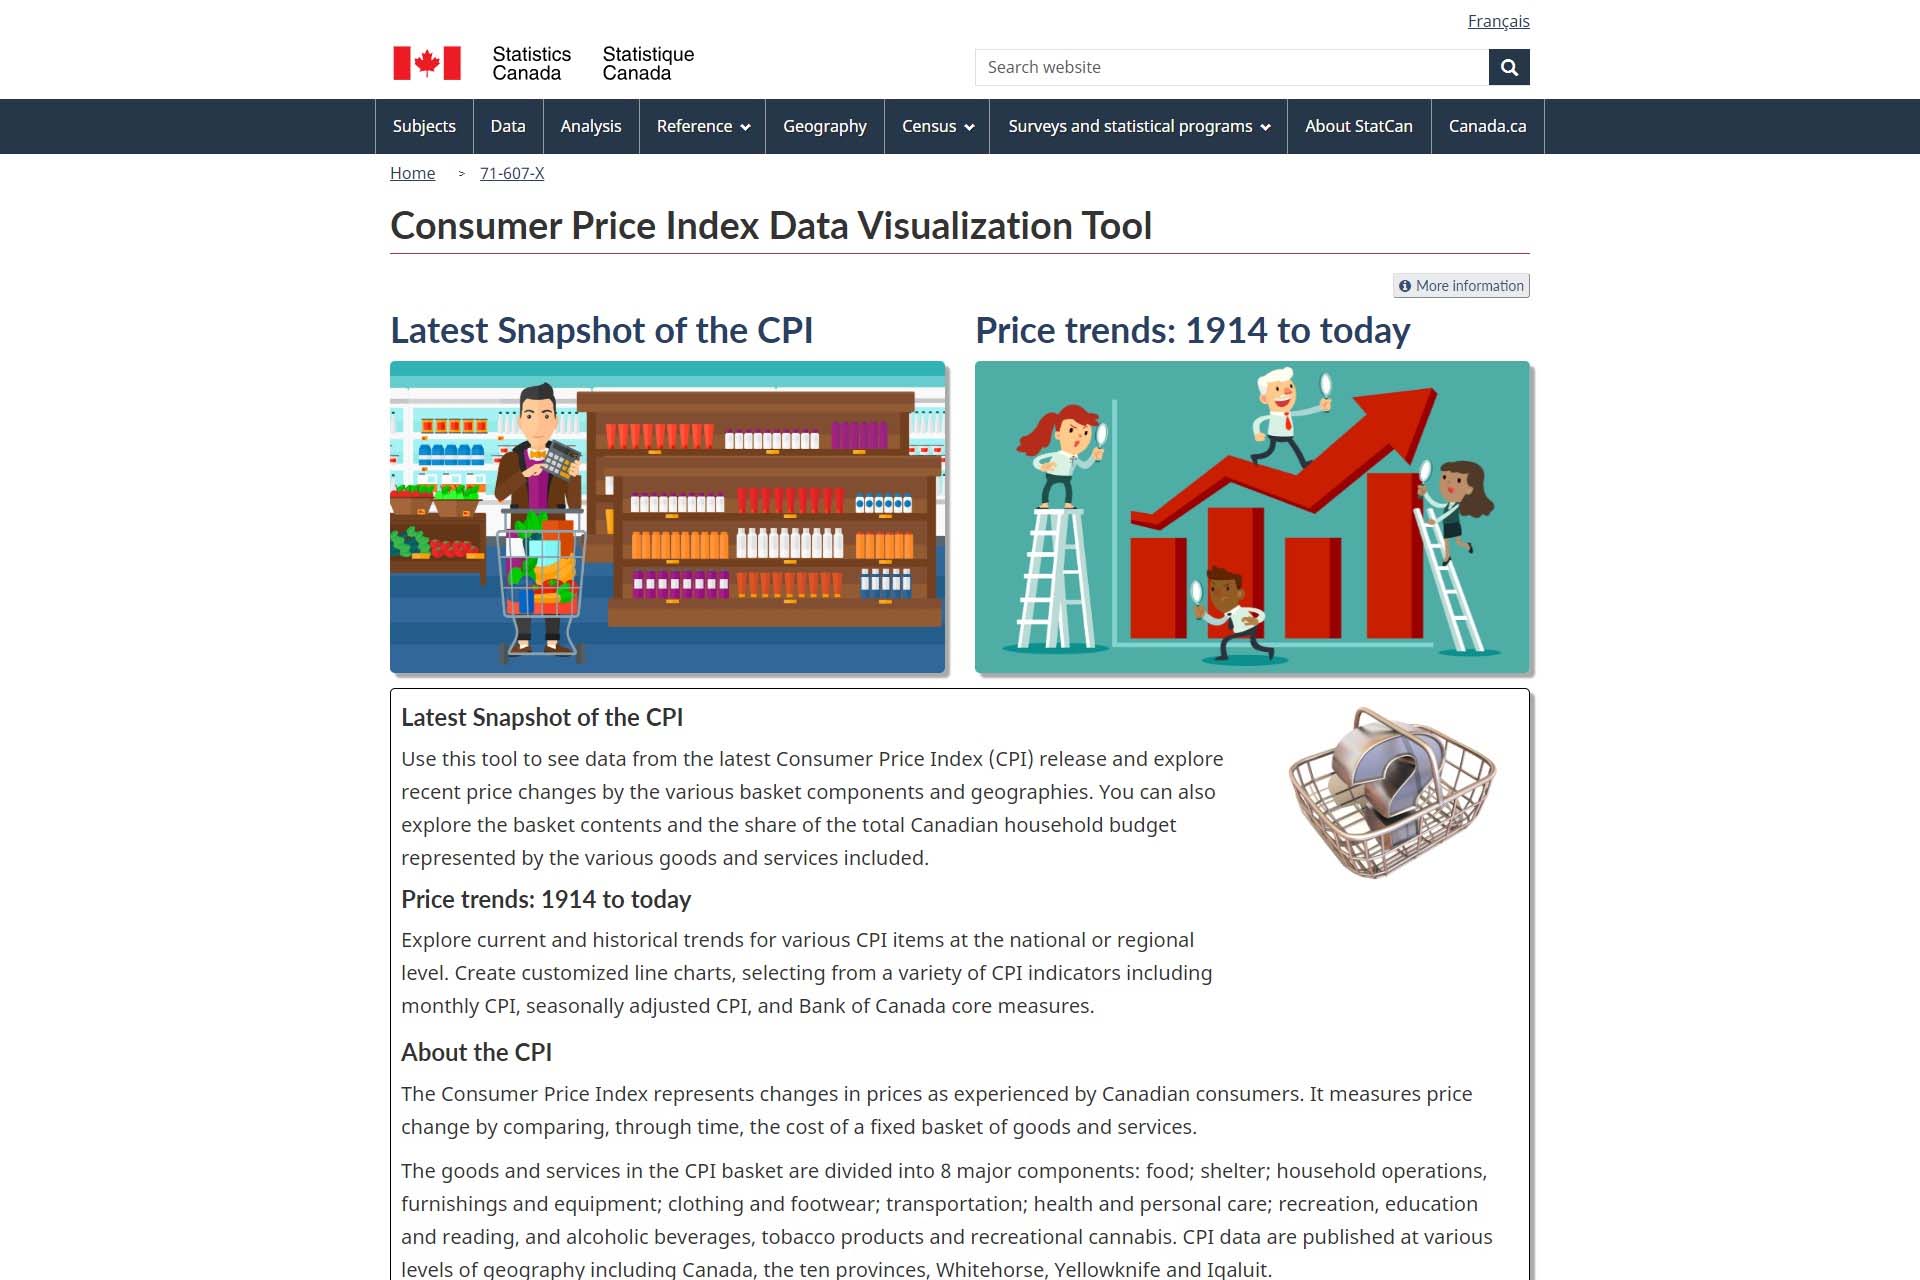
Consumer Price Index Data Visualization Tool
The “Consumer Price Index Data Visualization Tool” from Statistics Canada provides an interactive means to explore and understand the Consumer Price Index (CPI) data, detailing changes in the prices paid by Canadian consumers for a basket of goods and services. This tool is important for economic analysis, helping to measure inflation and guide economic policy. It offers insights into price changes over time, broken down by various categories and regions, crucial for businesses, policymakers, and researchers.
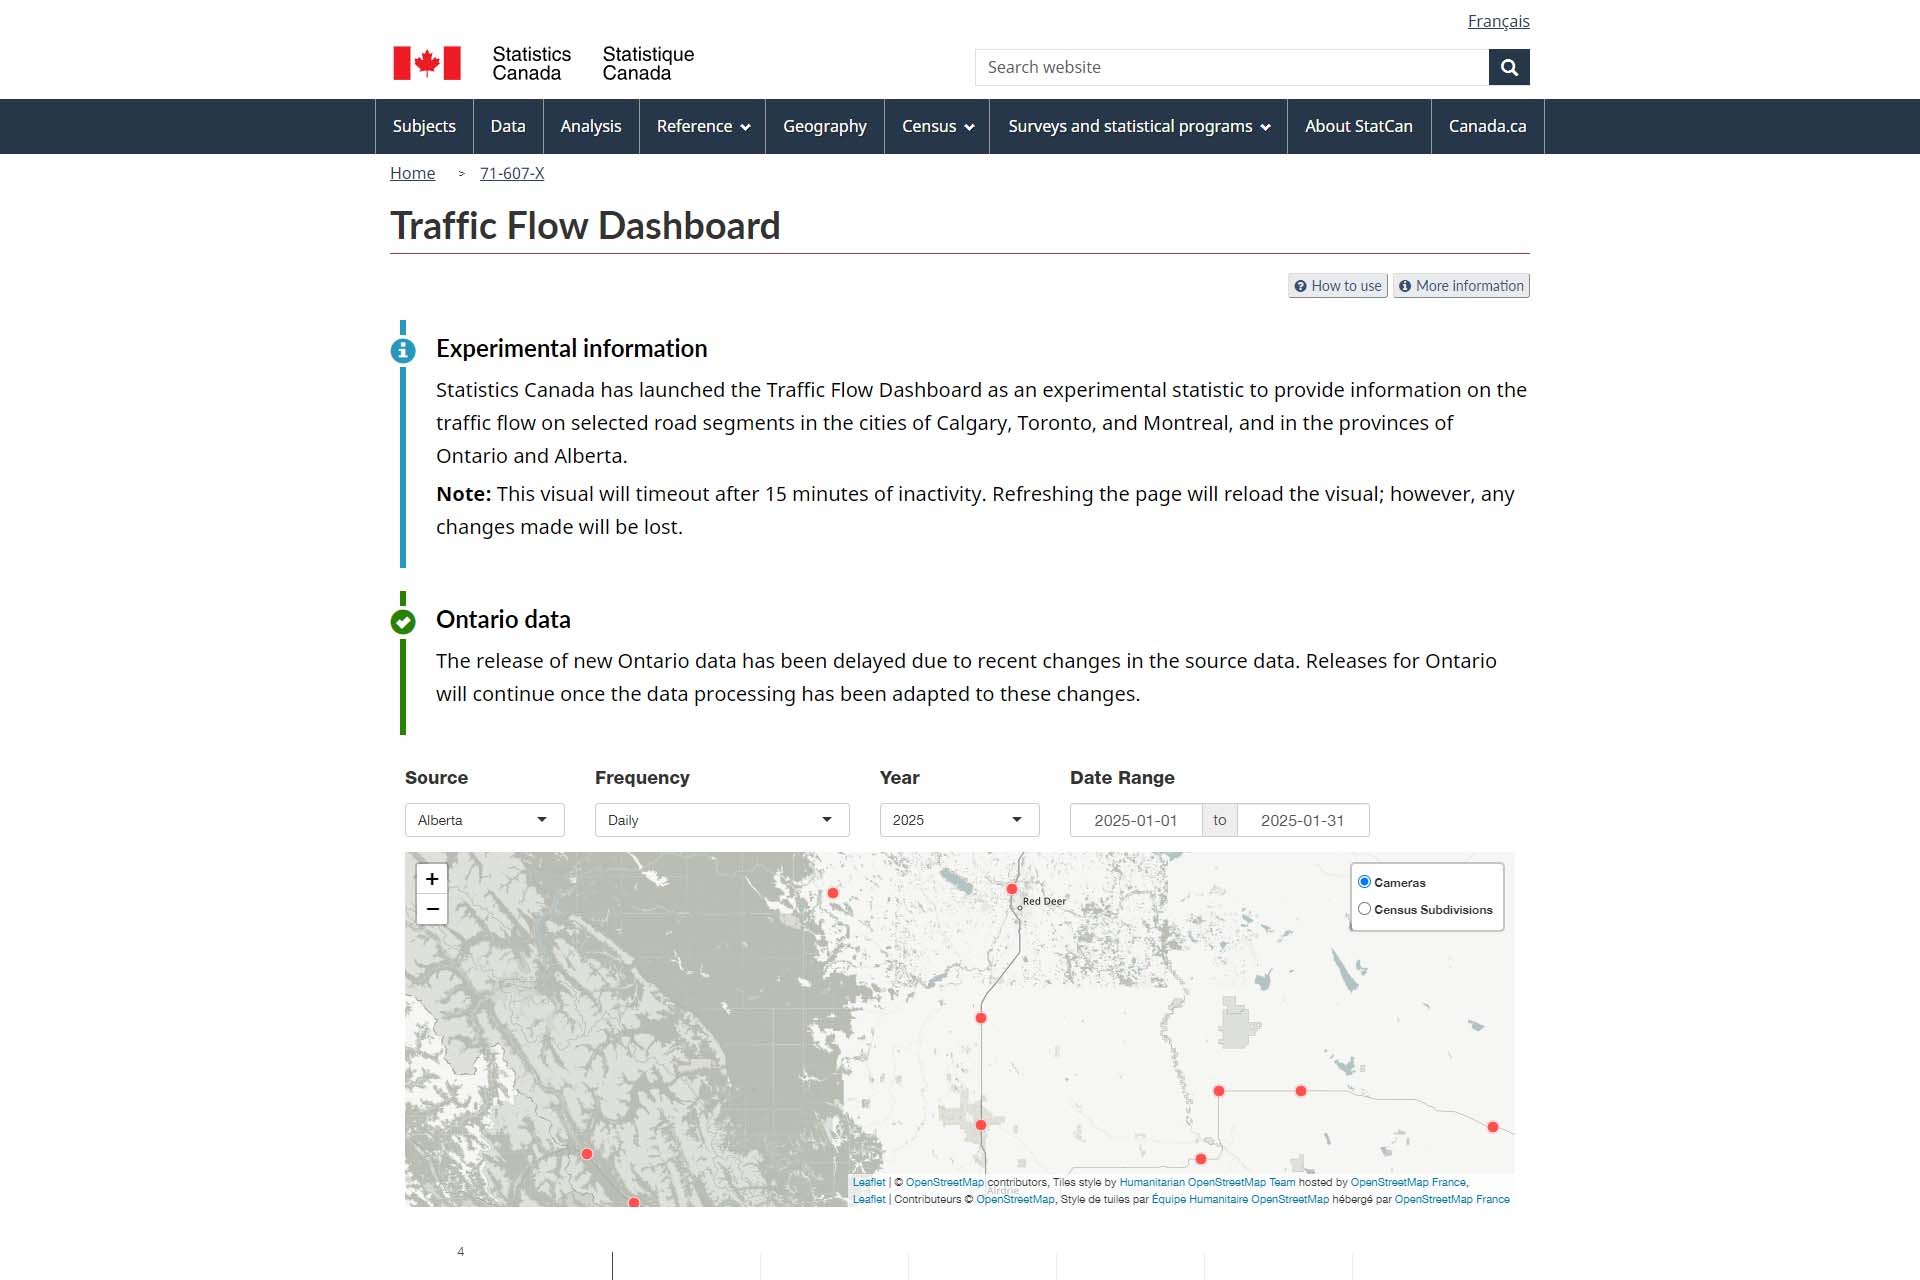
The “Traffic Flow Dashboard” from Statistics Canada is a pivotal tool that offers real-time, visual data on vehicle movements across key regions like Calgary, Toronto, and Montreal. Utilizing traffic camera imagery and advanced object detection models, this dashboard supports urban planning, traffic management, and policy making by providing insights into traffic patterns and volume fluctuations. This tool is especially valuable for transportation analysts and city planners aiming to optimize road use and reduce congestion.
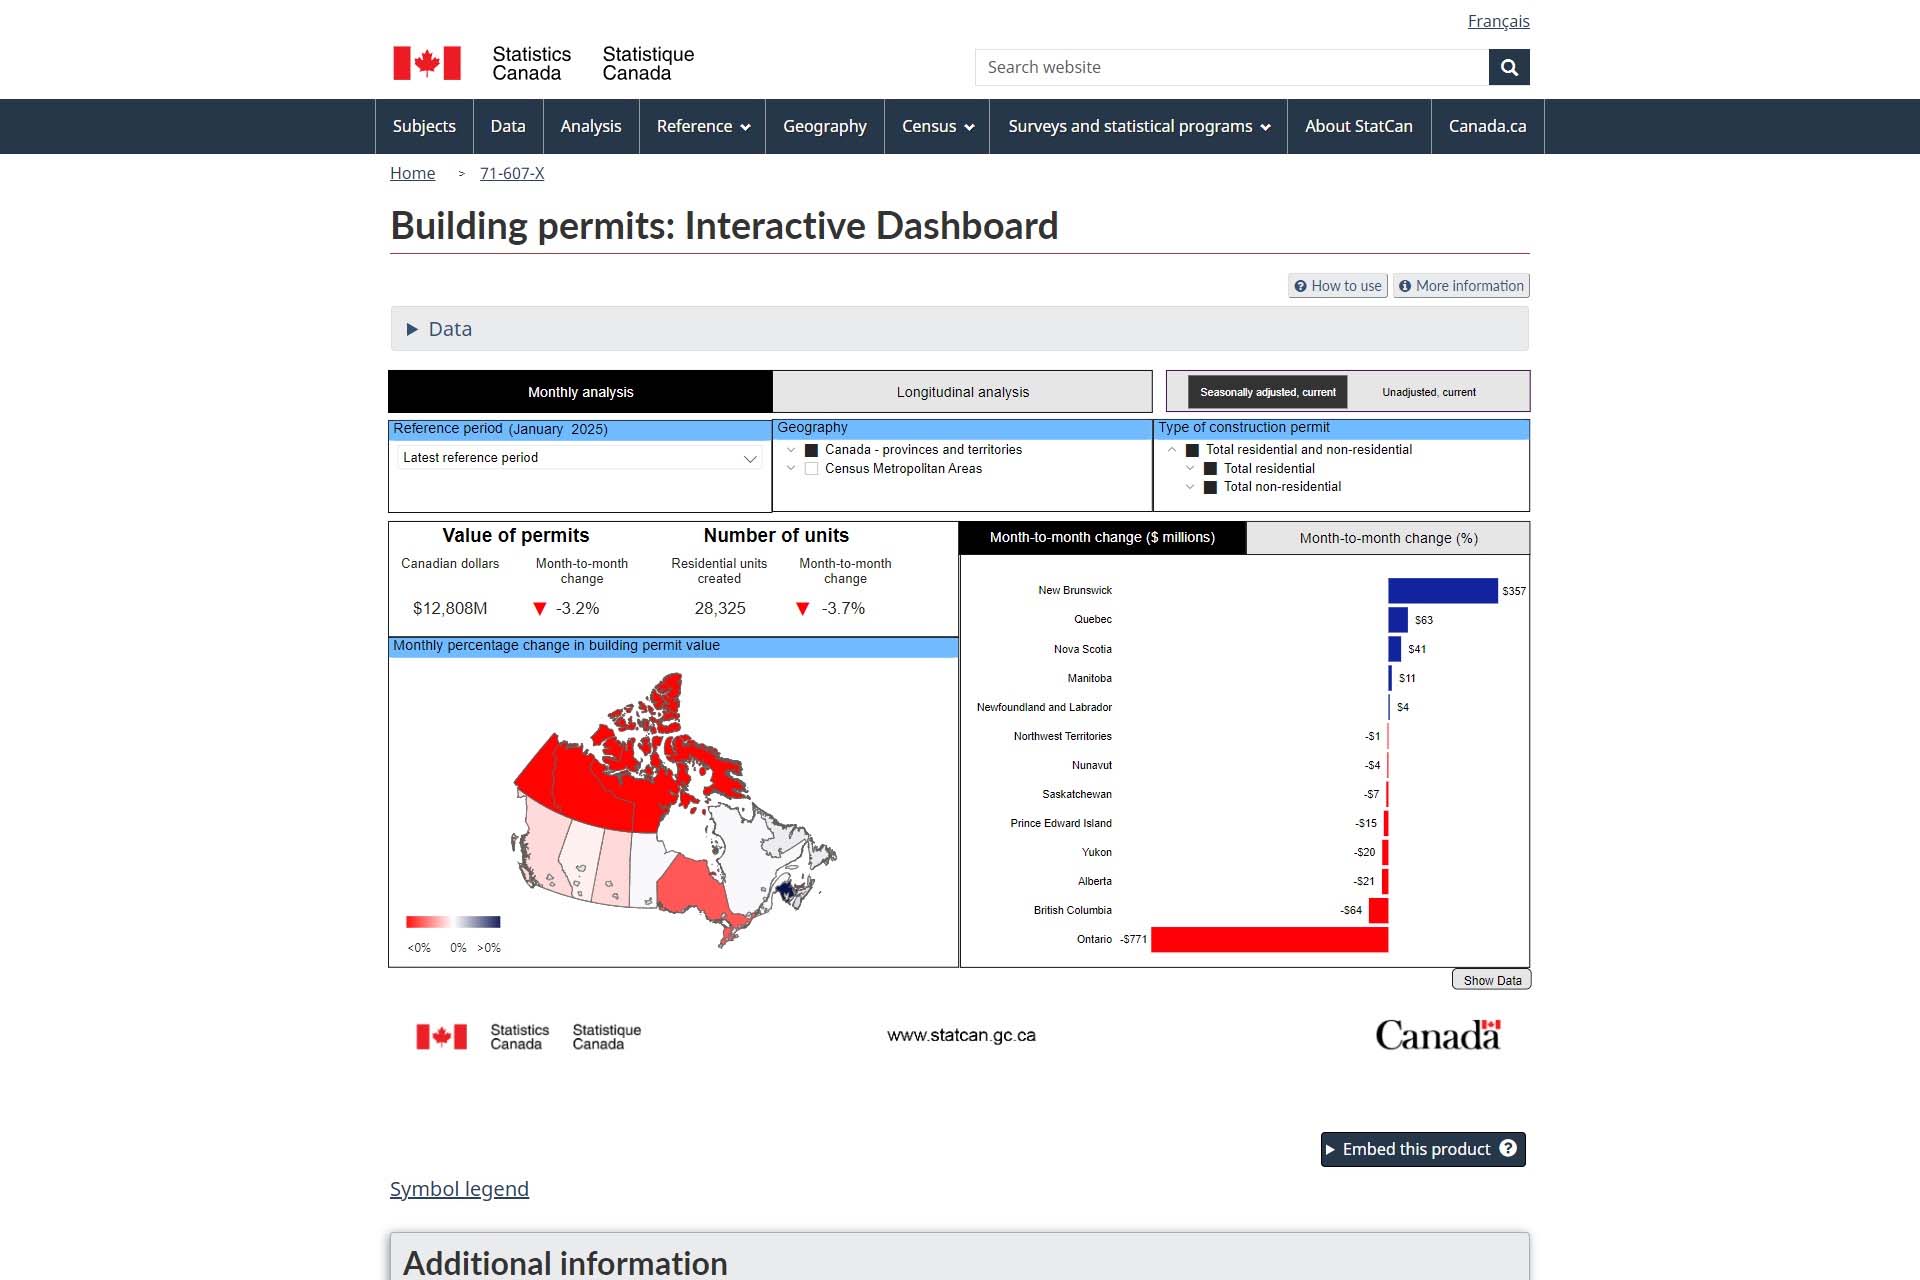
Building permits: Interactive Dashboard
The “Building Permits: Interactive Dashboard” from Statistics Canada provides a dynamic visualization of building permits data, essential for tracking construction trends and economic activity across Canada. The tool allows users to explore monthly and longitudinal data on the value of building permits and the number of residential units authorized, segmented by geography and permit type. This tool is crucial for urban planners, economists, and government officials involved in development planning and policy making.
The “Canadian Economic Tracker” from Statistics Canada is a vital data visualization tool that provides up-to-date information on key economic indicators such as GDP, consumer prices, labor market statistics, and trade data. This tool is crucial for economists, policymakers, businesses, and the general public to understand and respond to the dynamic nature of Canada’s economy in real-time, enabling informed decision-making and strategic planning.
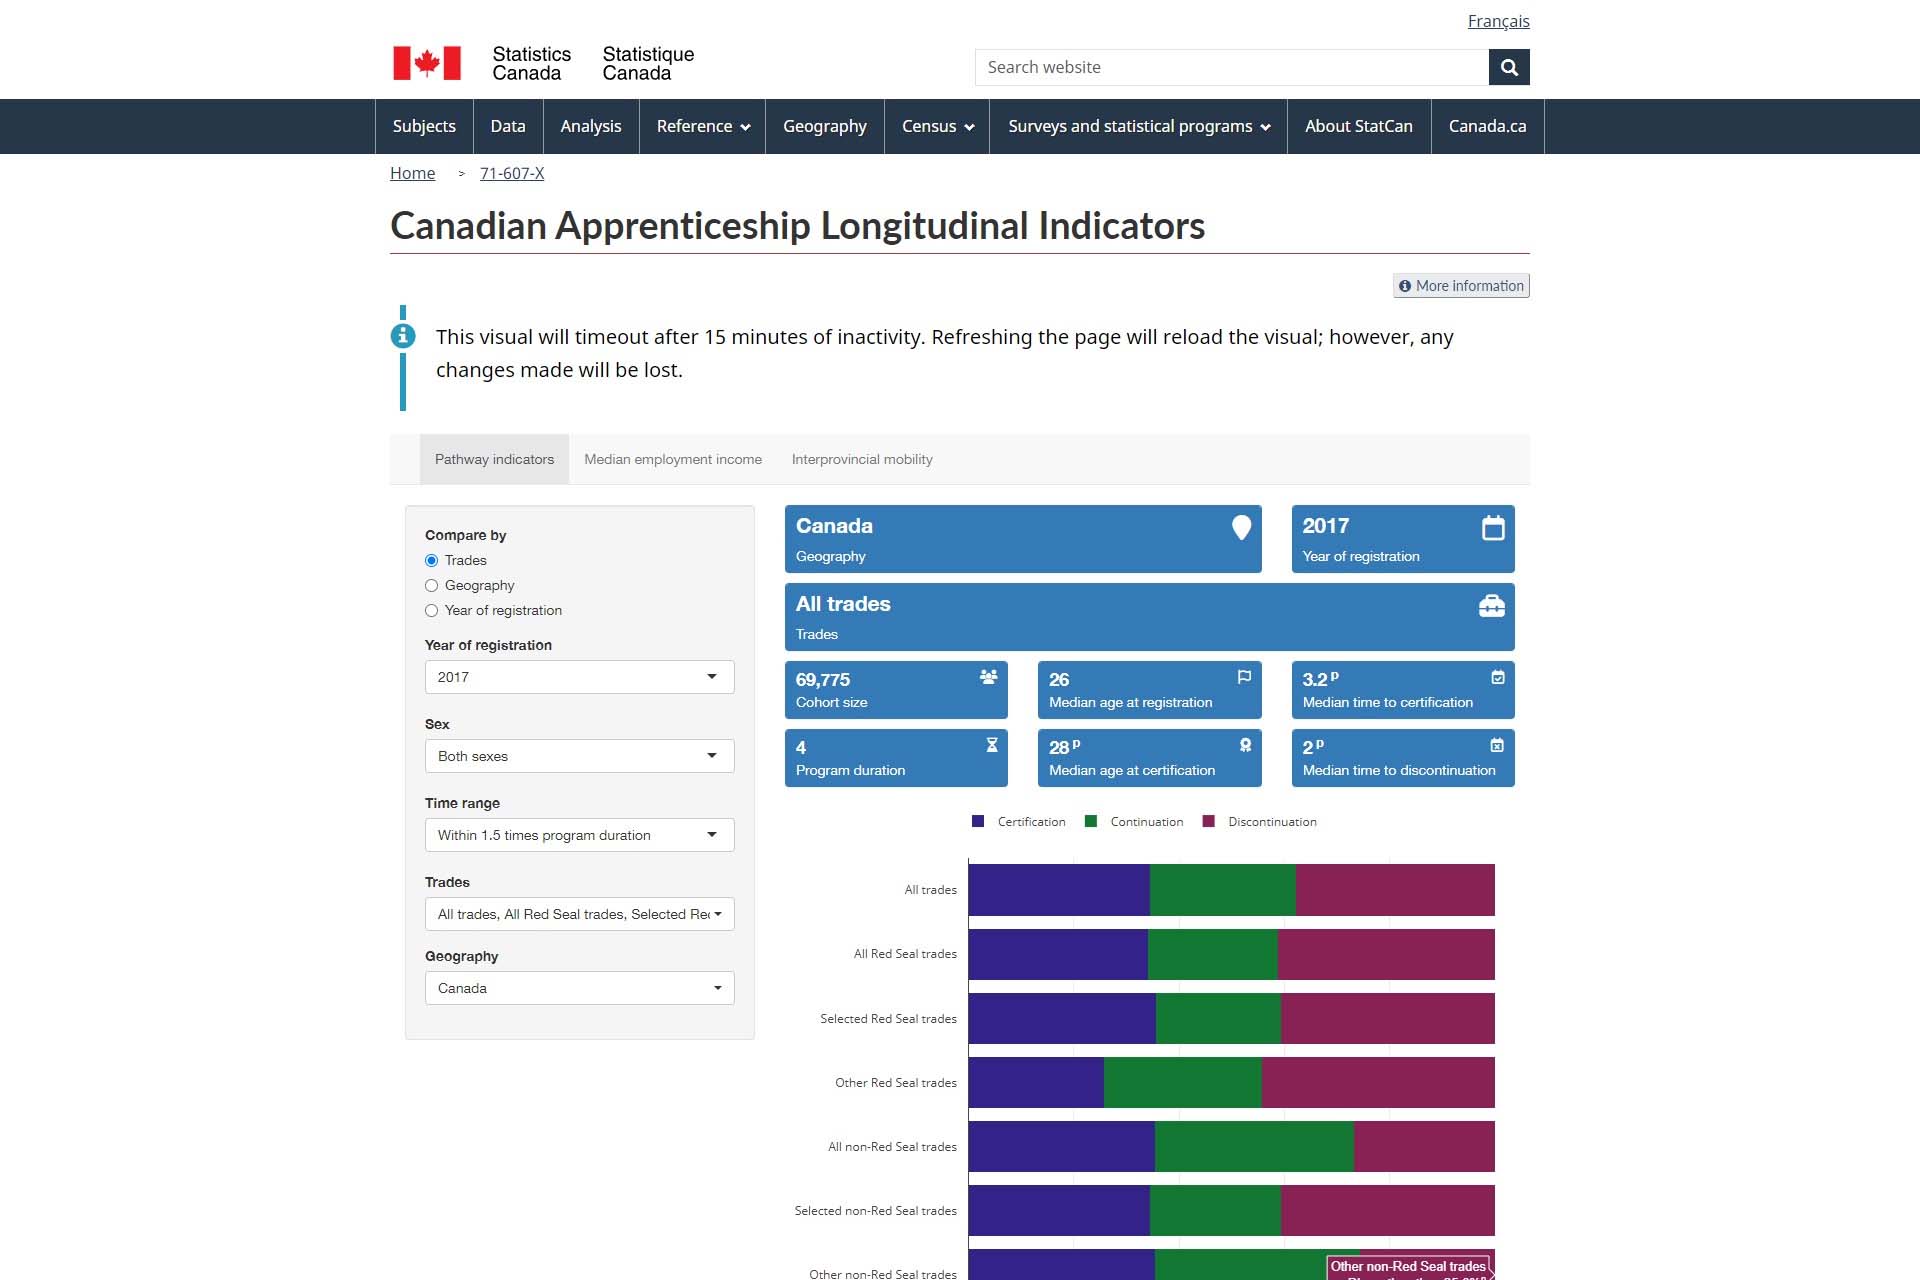
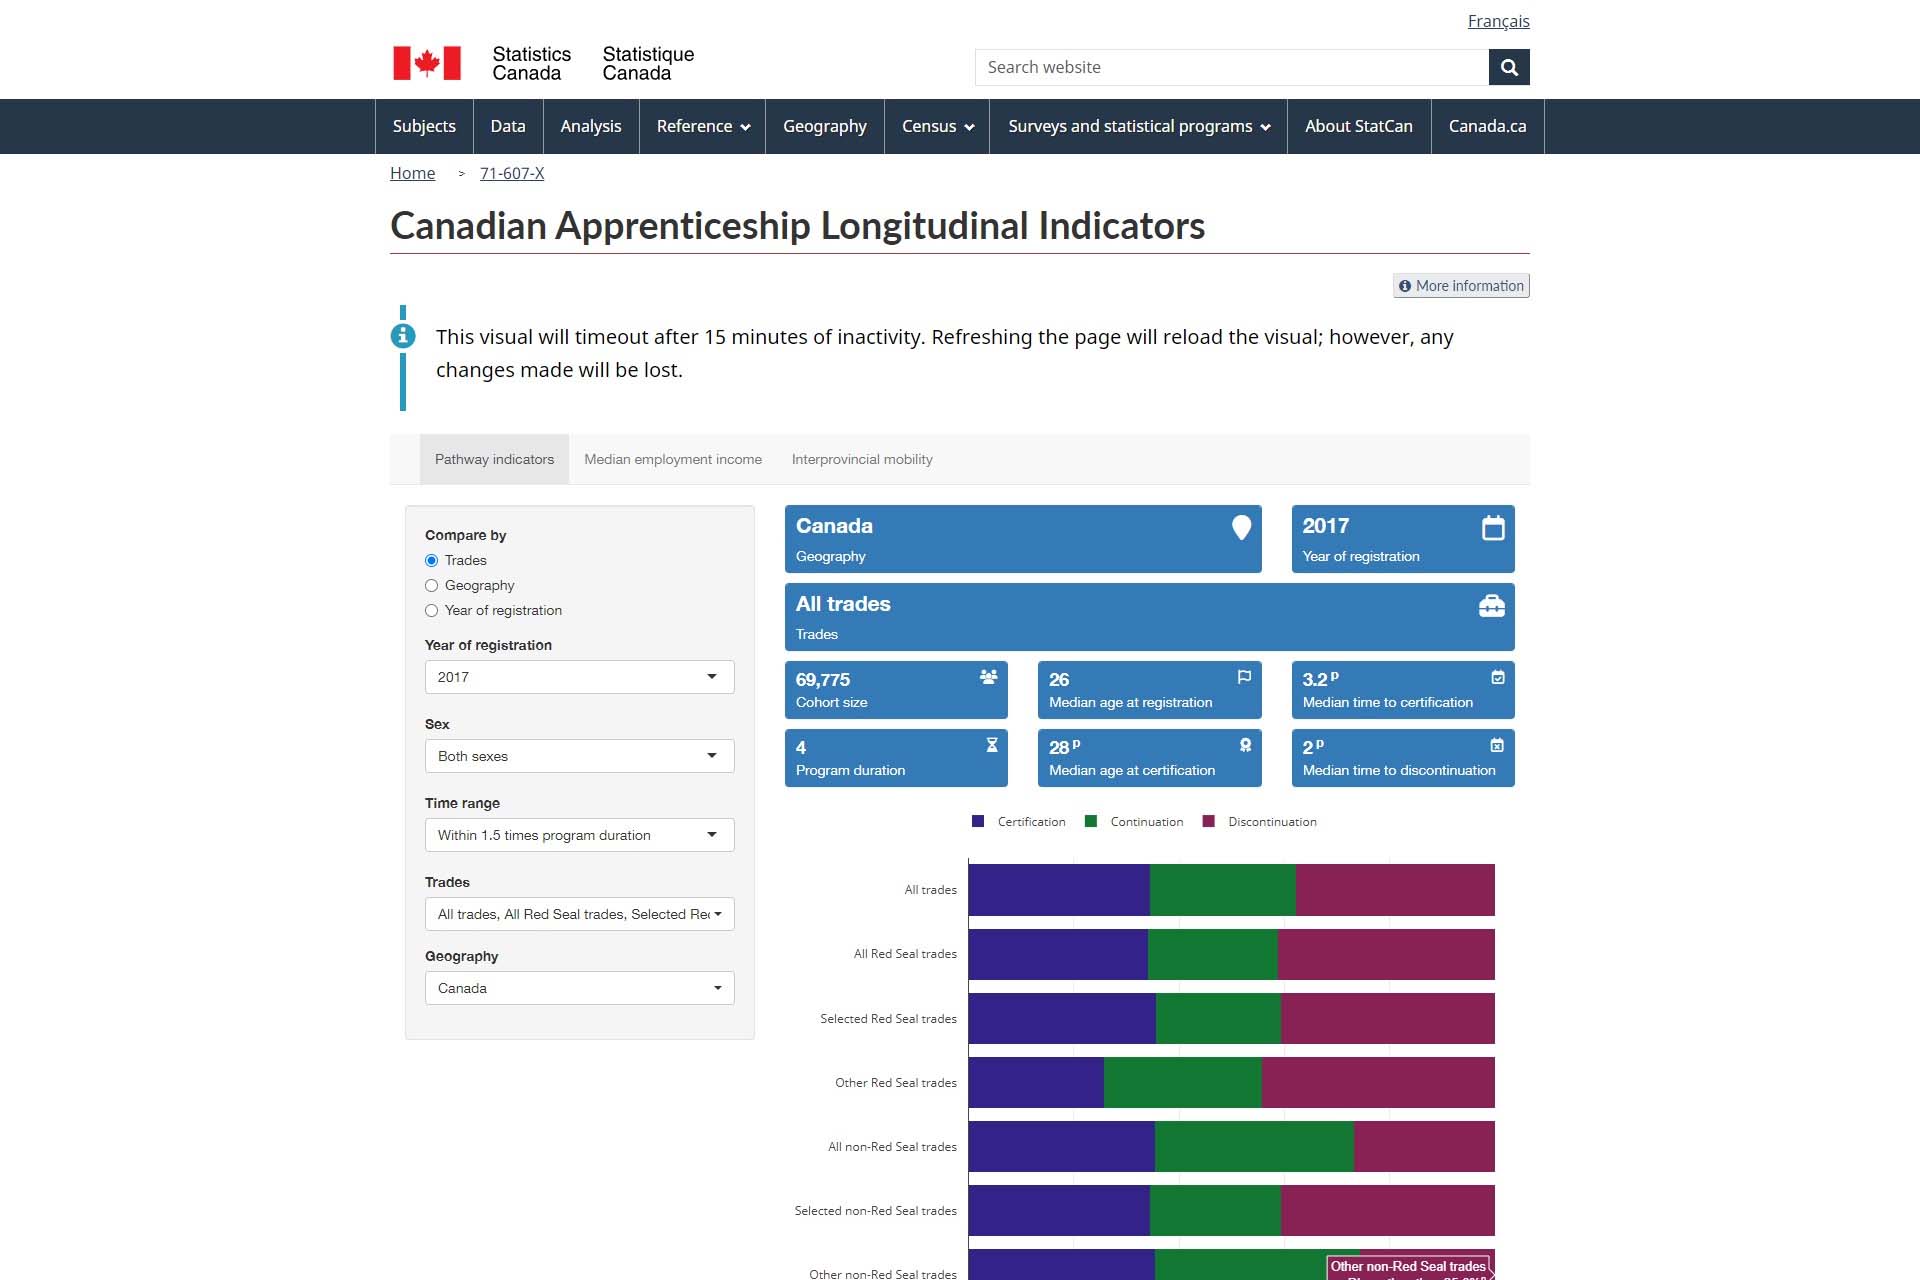
Canadian Apprenticeship Longitudinal Indicators
The “Canadian Apprenticeship Longitudinal Indicators” from Statistics Canada offers detailed insights into the progression, outcomes, and employment statistics of apprentices across Canada. This tool is crucial for understanding trends in skilled trades education, including certification rates, continuation and discontinuation of apprenticeships, as well as the mobility and income levels of journeypersons post-certification. This data aids policymakers, educators, and industry leaders in improving training programs and addressing workforce needs in various trades.
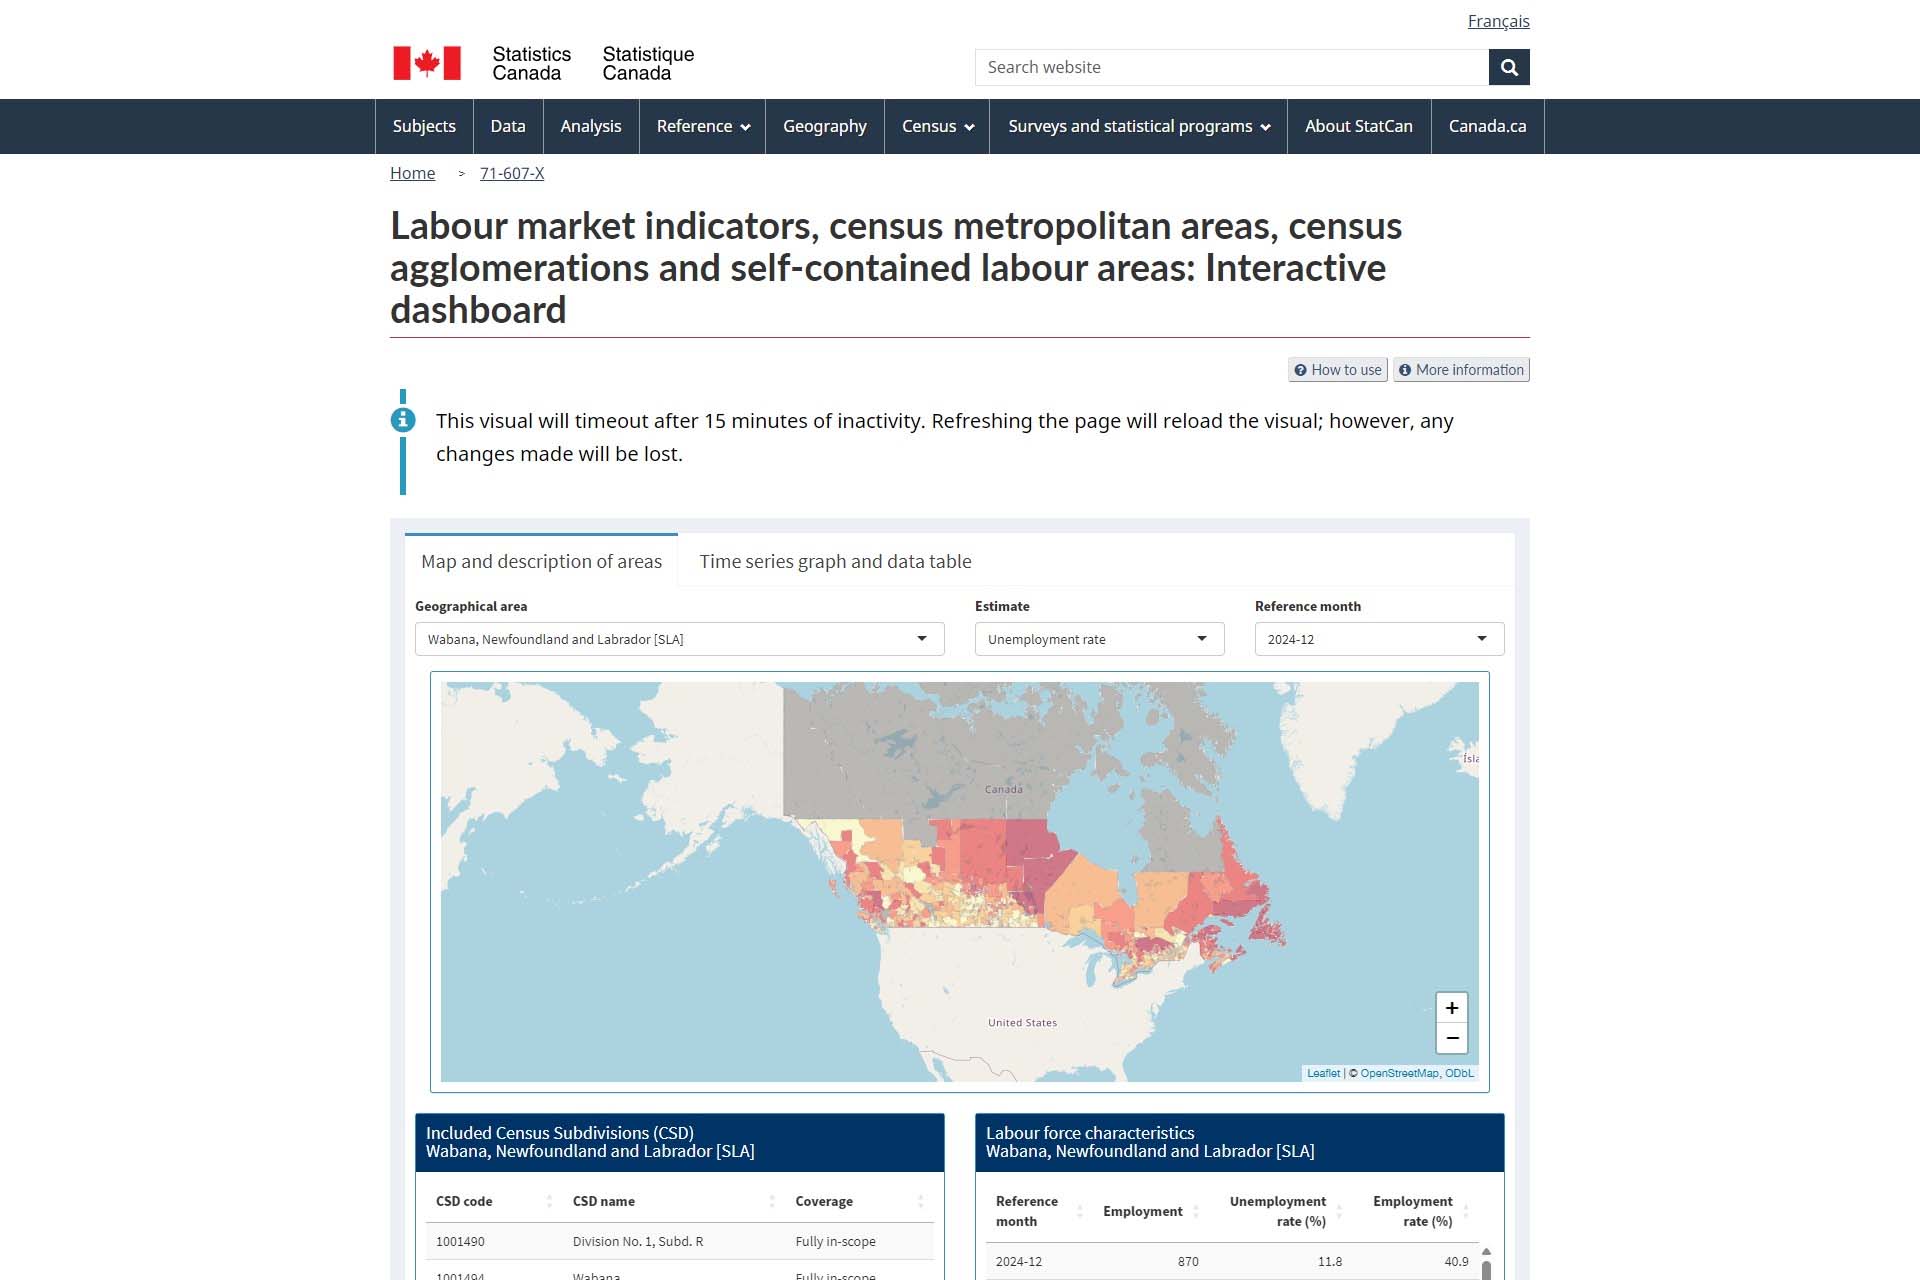
The “Labour Market Indicators” interactive dashboard from Statistics Canada provides detailed estimates of employment rates, unemployment rates, and overall employment figures for specific geographic areas like Census Metropolitan Areas (CMA), Census Agglomerations (CA), and Self-contained Labour Areas (SLA). This tool is essential for government officials, policymakers, and researchers focused on regional economic development and workforce planning, offering nuanced insights that aid in targeted decision-making and policy formulation.
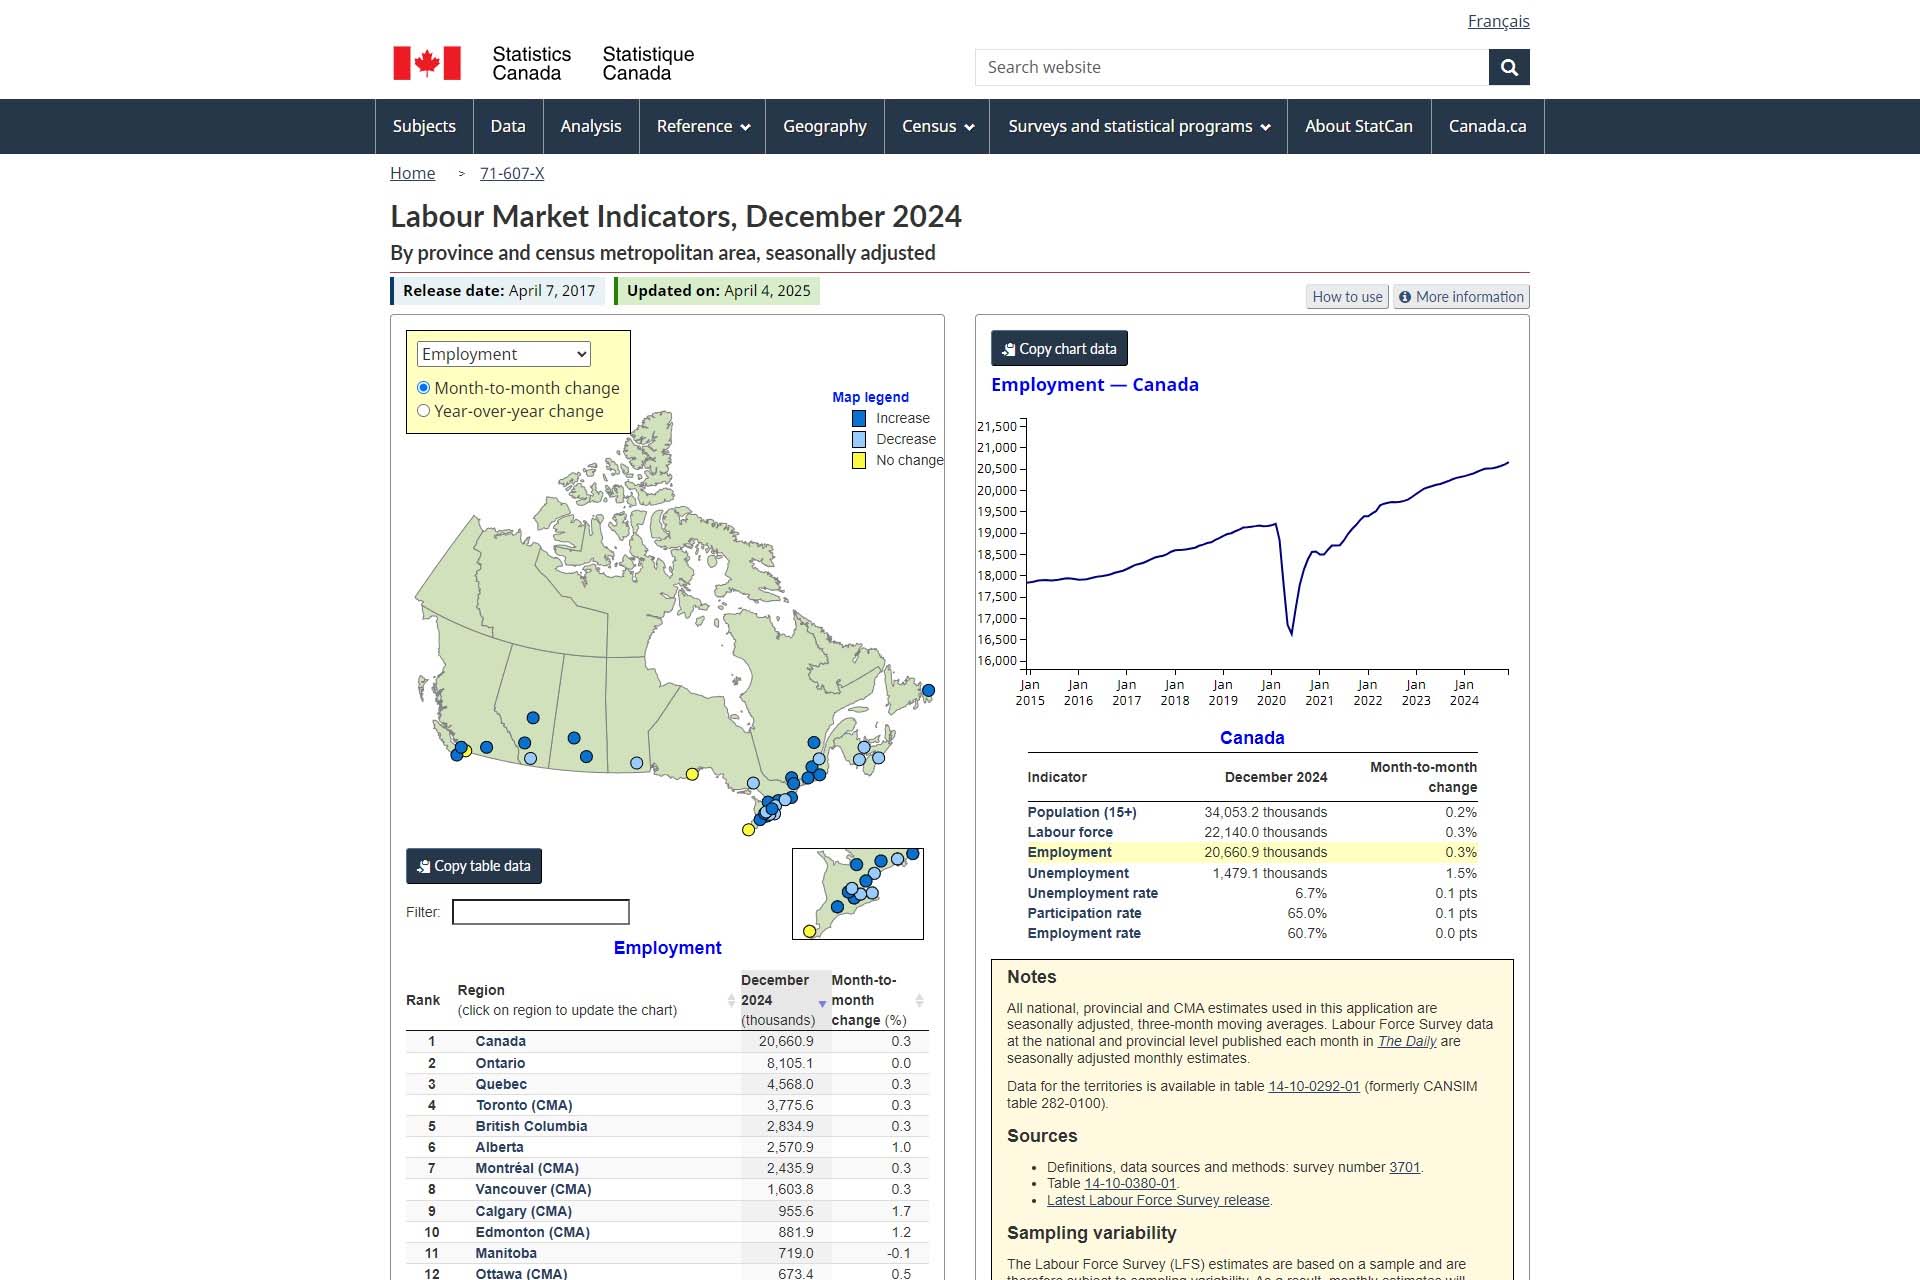
Labour Market Indicators, December 2024
By province and census metropolitan area, seasonally adjusted “Labour Market Indicators” data product from Statistics Canada provides seasonally adjusted, monthly labour force statistics by province and census metropolitan area. This includes data on employment rates, unemployment rates, and participation rates, which are essential for monitoring and understanding regional economic health and workforce trends. This tool is particularly important for policymakers, economists, and business leaders involved in labour market planning and economic development.
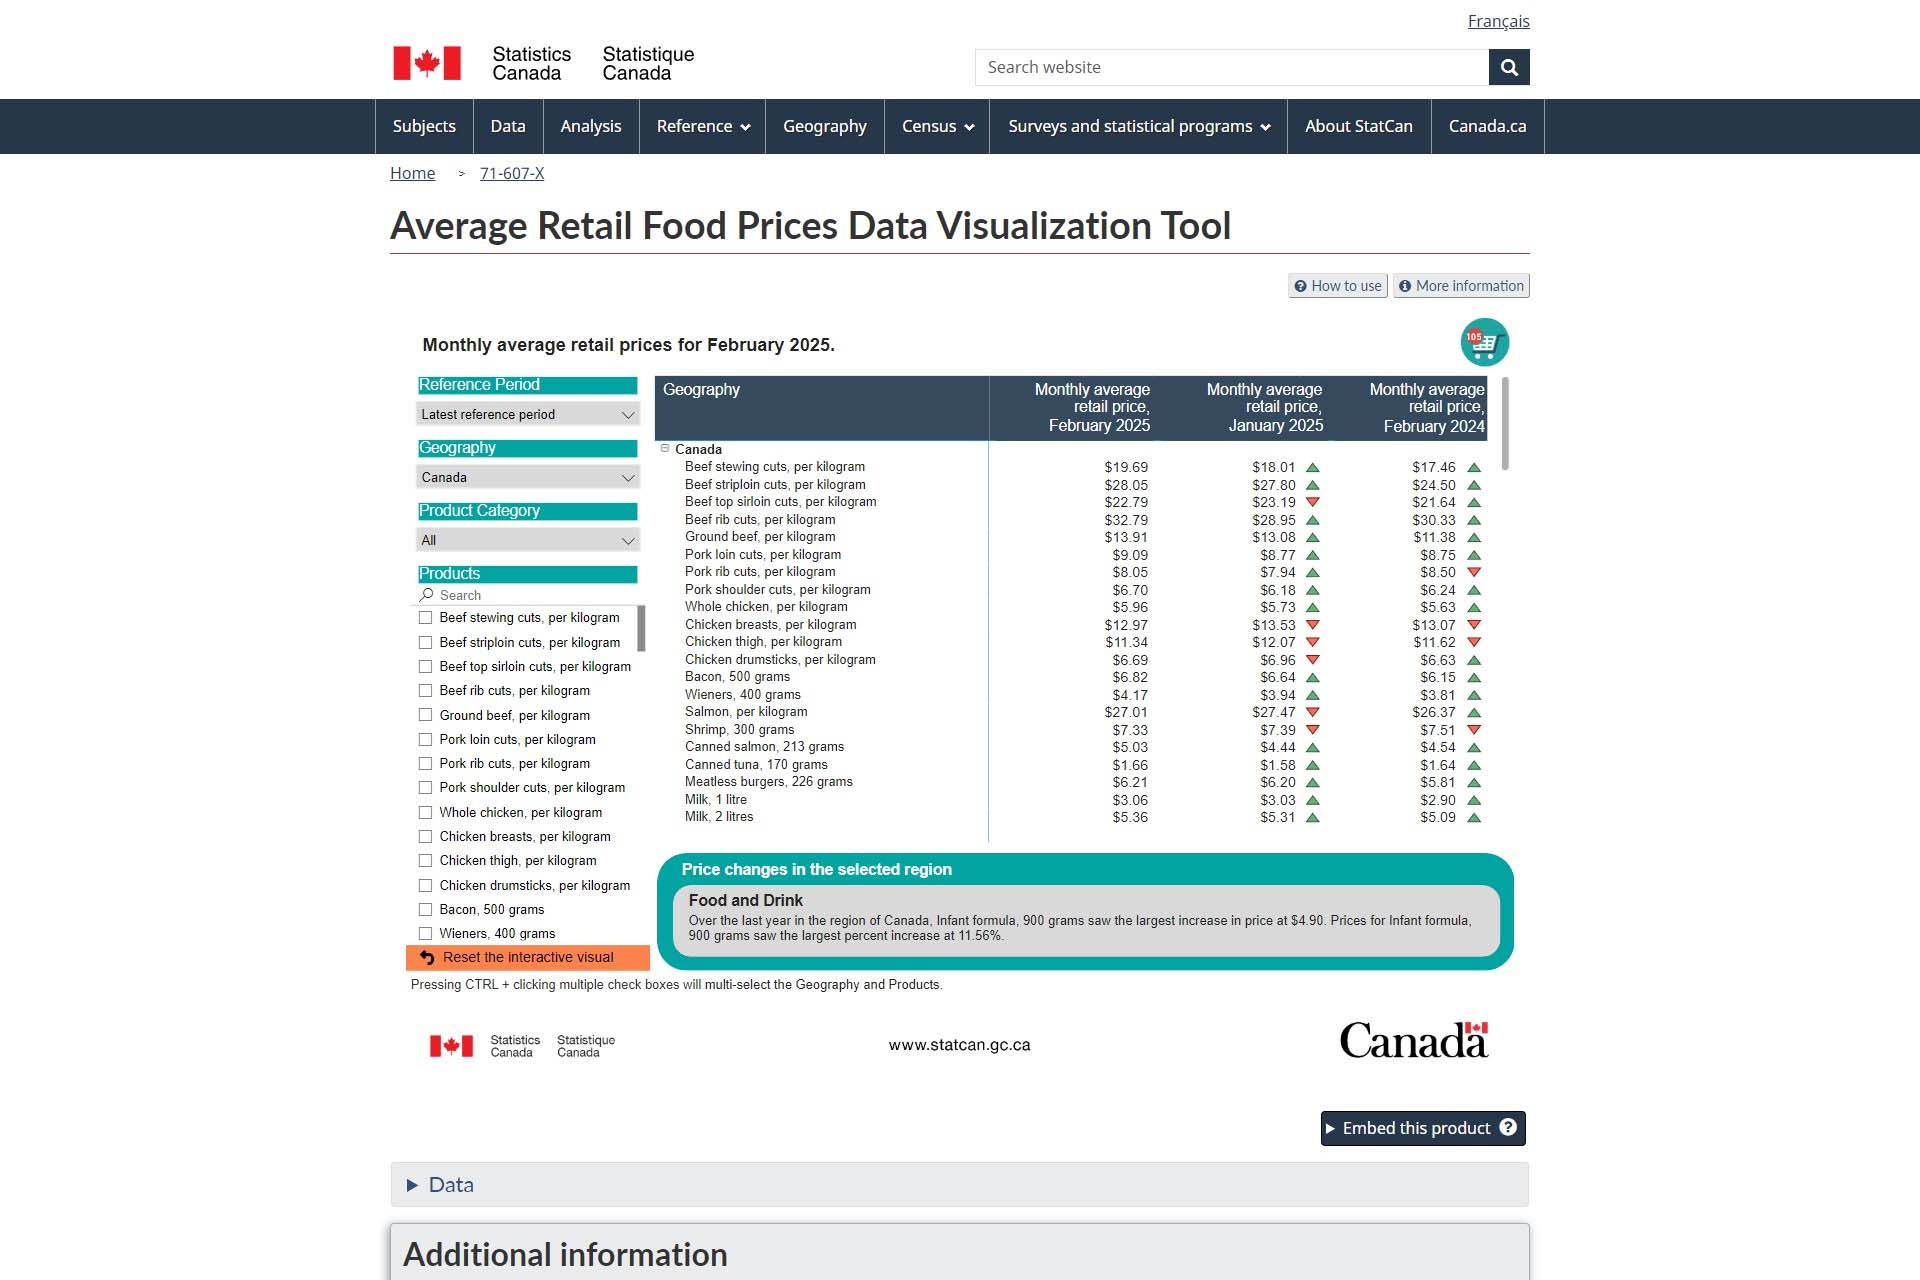
Average Retail Food Prices Data Visualization Tool
The “Average Retail Food Prices Data Visualization Tool” from Statistics Canada offers an interactive way to explore monthly average retail prices for selected food products across different provinces. This tool is vital for economists, policymakers, and consumers to track food price trends and assess cost of living changes over time. It helps in understanding economic indicators related to consumer spending and inflation, thereby supporting informed decision-making.

Elementary to Postsecondary Student Education Dashboard: Enrolments, Graduations and Tuition Fees
The “Elementary to Postsecondary Student Education Dashboard: Enrolments, Graduations and Tuition Fees” from Statistics Canada is an indispensable tool that tracks student statistics across various educational stages in Canada. This interactive dashboard offers insights into enrolment numbers, graduation rates, and tuition fees, providing a comprehensive overview of the educational landscape. Such data is vital for policymakers, educational institutions, and researchers in shaping educational policies and understanding trends in the sector.
Canadian Apprenticeship Registrations and Certifications
The “Canadian Apprenticeship Registrations and Certifications” data product from Statistics Canada provides comprehensive insights into the trends of apprenticeship registrations and certifications across Canada. This tool is crucial for understanding the dynamics of the skilled trades workforce, including registrations by trade, gender, and age, and the certification outcomes. This information aids stakeholders in developing targeted policies and programs to support the skilled trades sector.
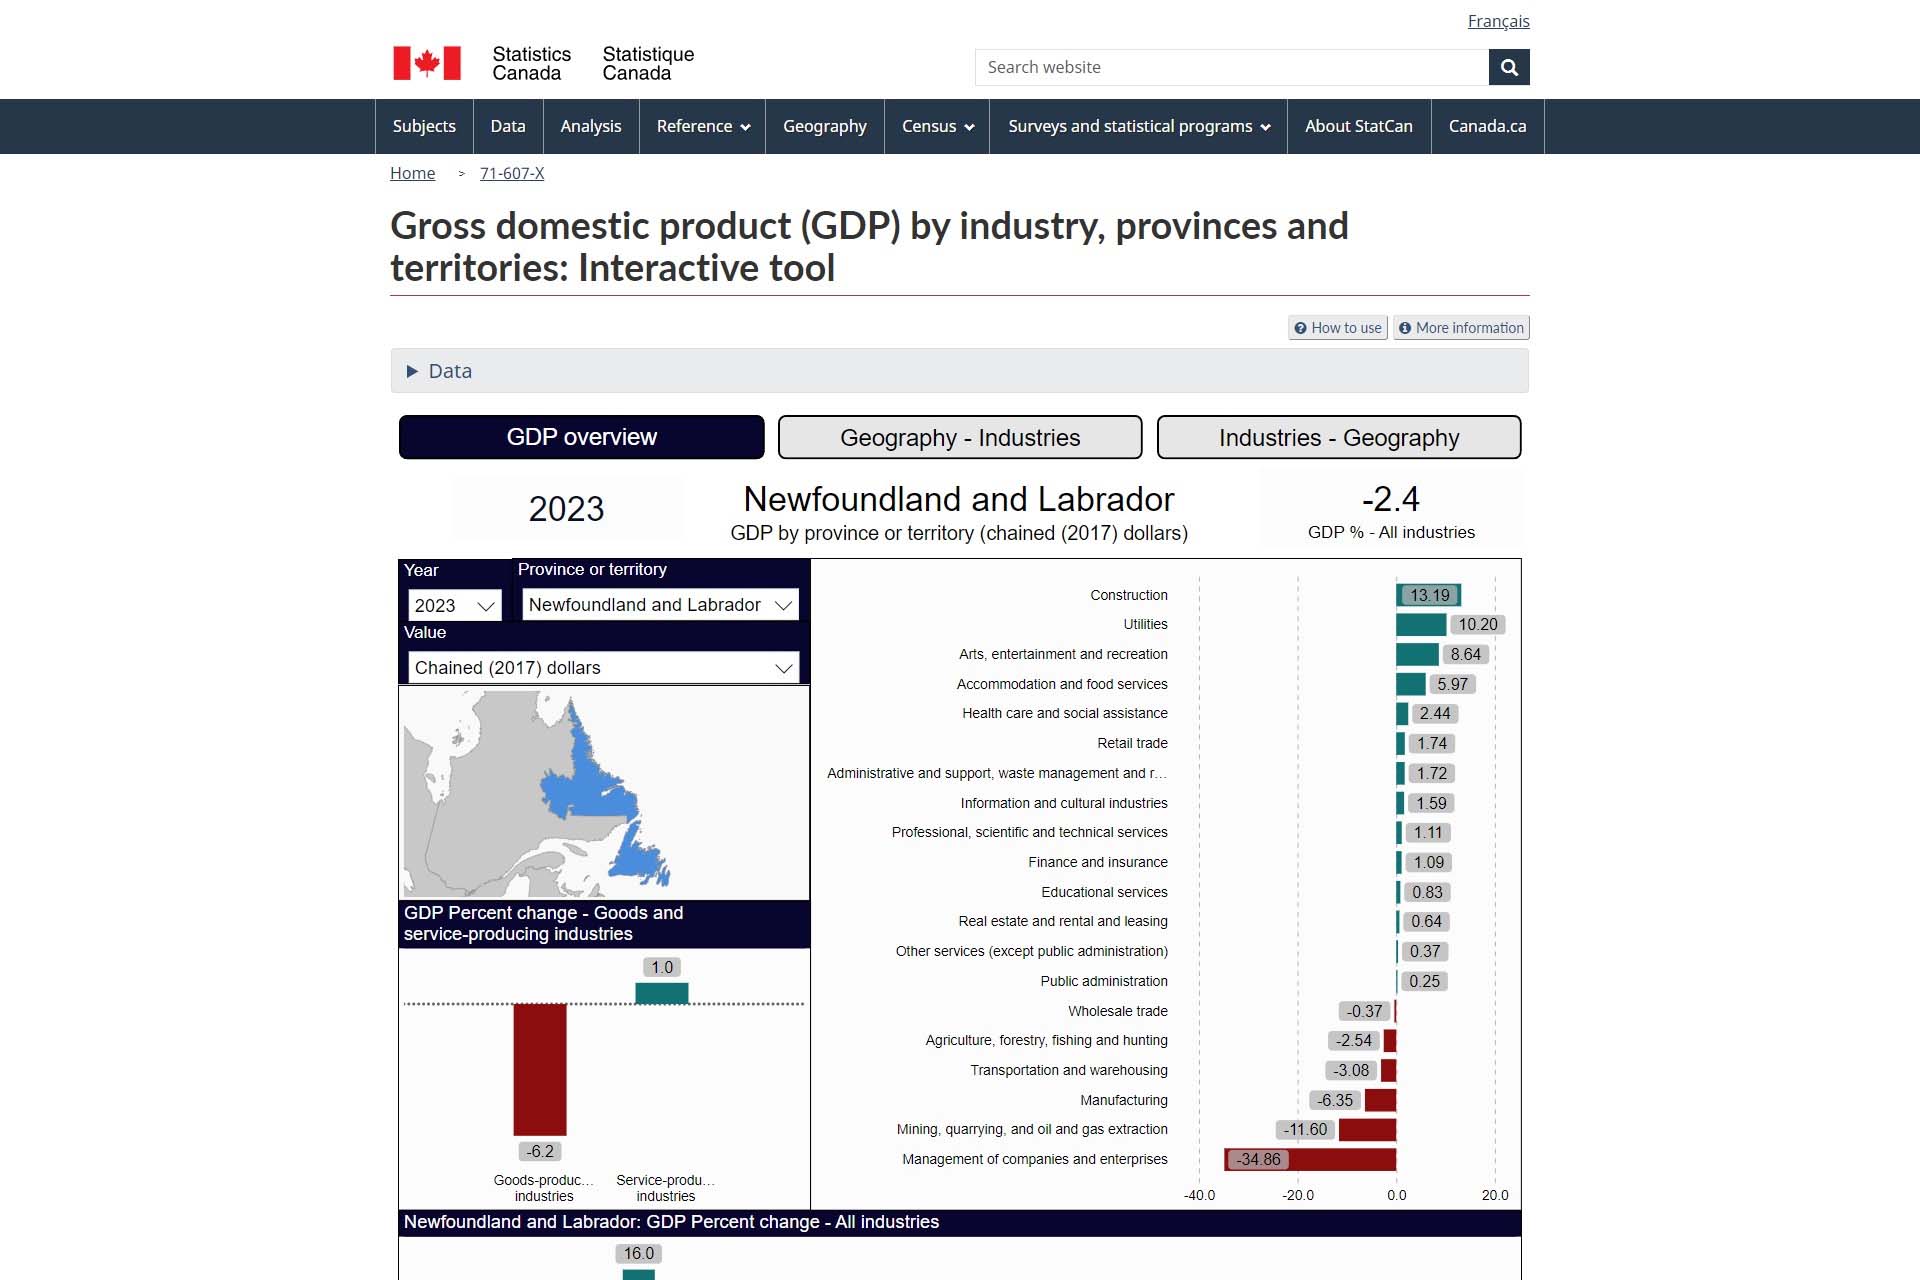
Gross domestic product (GDP) by industry, provinces and territories: Interactive tool
The “Gross Domestic Product (GDP) by Industry, Provinces and Territories” interactive tool from Statistics Canada provides detailed insights into economic production across different regions and industries in Canada. This tool allows users to examine GDP changes at basic prices, enabling stakeholders like economists, policymakers, and business leaders to analyze economic performance comprehensively. Such insights assist in informed decision-making and strategic planning to foster economic growth.
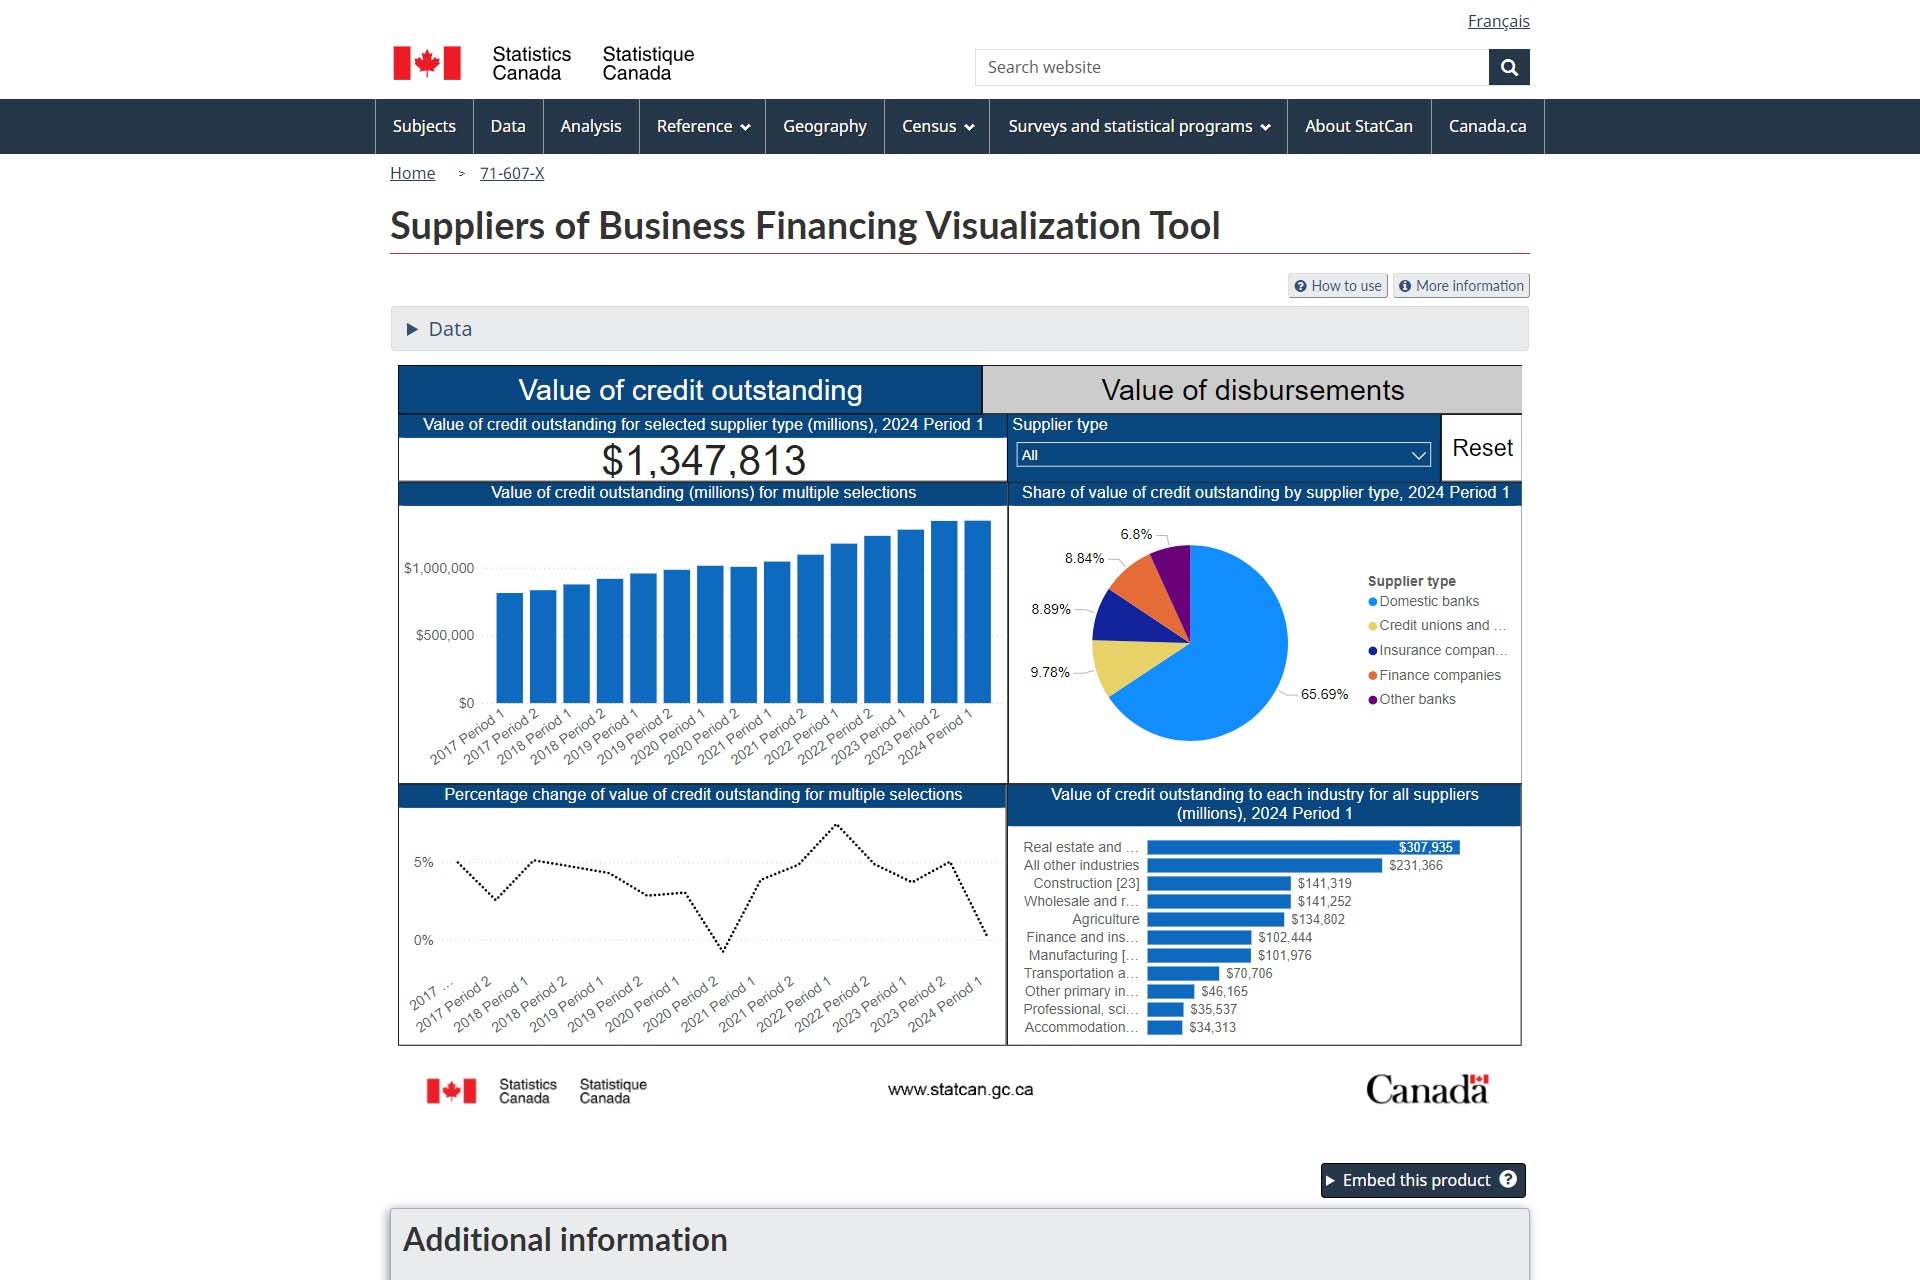
Suppliers of Business Financing Visualization Tool
The “Suppliers of Business Financing Visualization Tool” from Statistics Canada is a significant resource that displays data about financing available to Canadian businesses. It breaks down the value of credit outstanding and disbursements by various types of suppliers, such as banks and credit unions, which is crucial for understanding how businesses finance their operations and for policy formulation related to business finance.
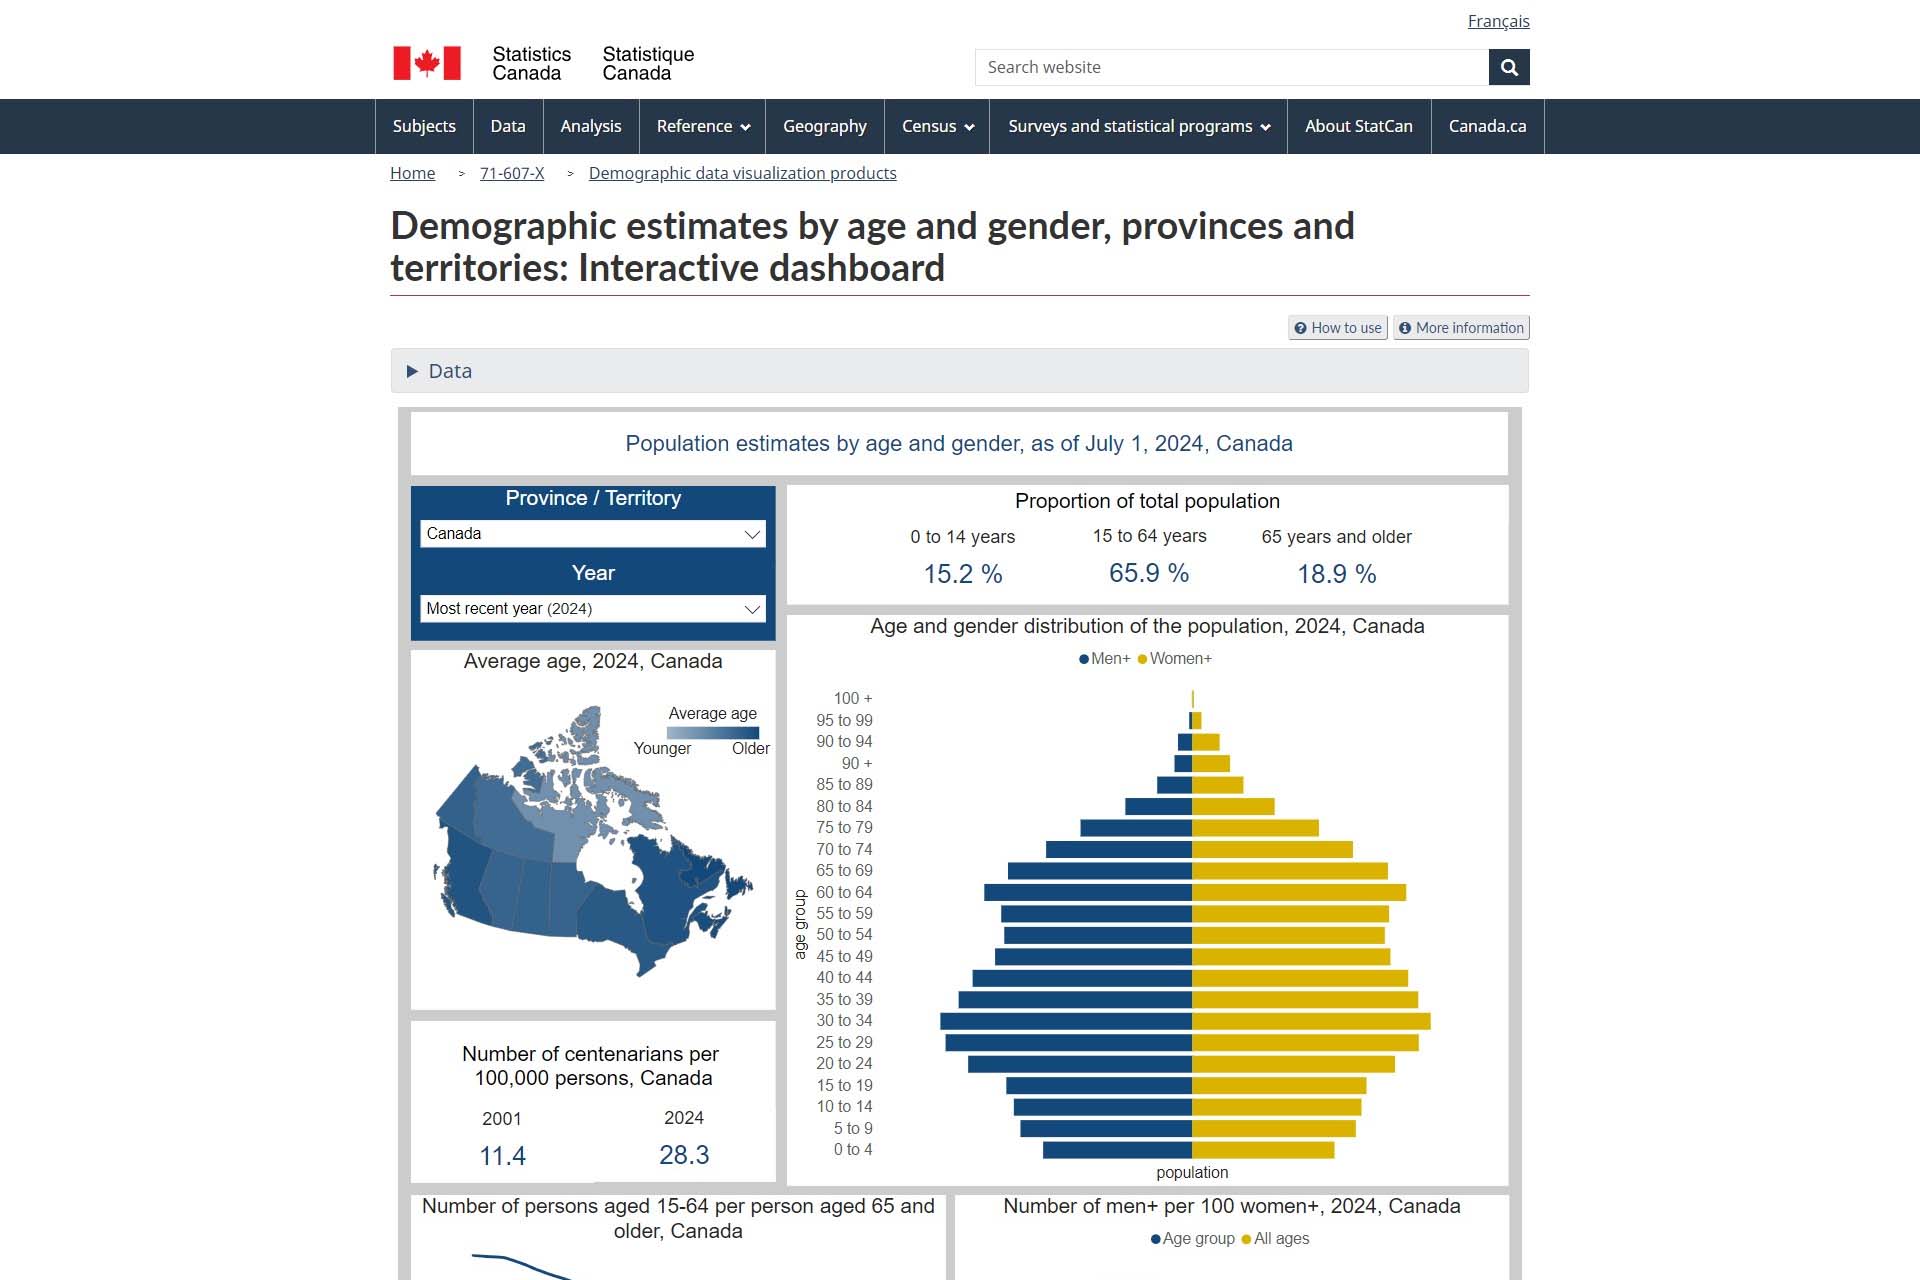
Demographic estimates by age and gender, provinces and territories: Interactive dashboard
The “Demographic Estimates by Age and Gender, Provinces and Territories: Interactive Dashboard” from Statistics Canada is a vital resource for visualizing the age and gender composition of Canada’s population across different regions. Covering data from 1971 to the most recent year, the dashboard presents key metrics such as the proportion of the population by broad age groups, the percentage of centenarians, age and gender distribution, average age, and dependency ratios. This tool is essential for policymakers, researchers, and demographers to analyze demographic trends, plan social services, and develop policies tailored to the evolving needs of Canada’s diverse population.
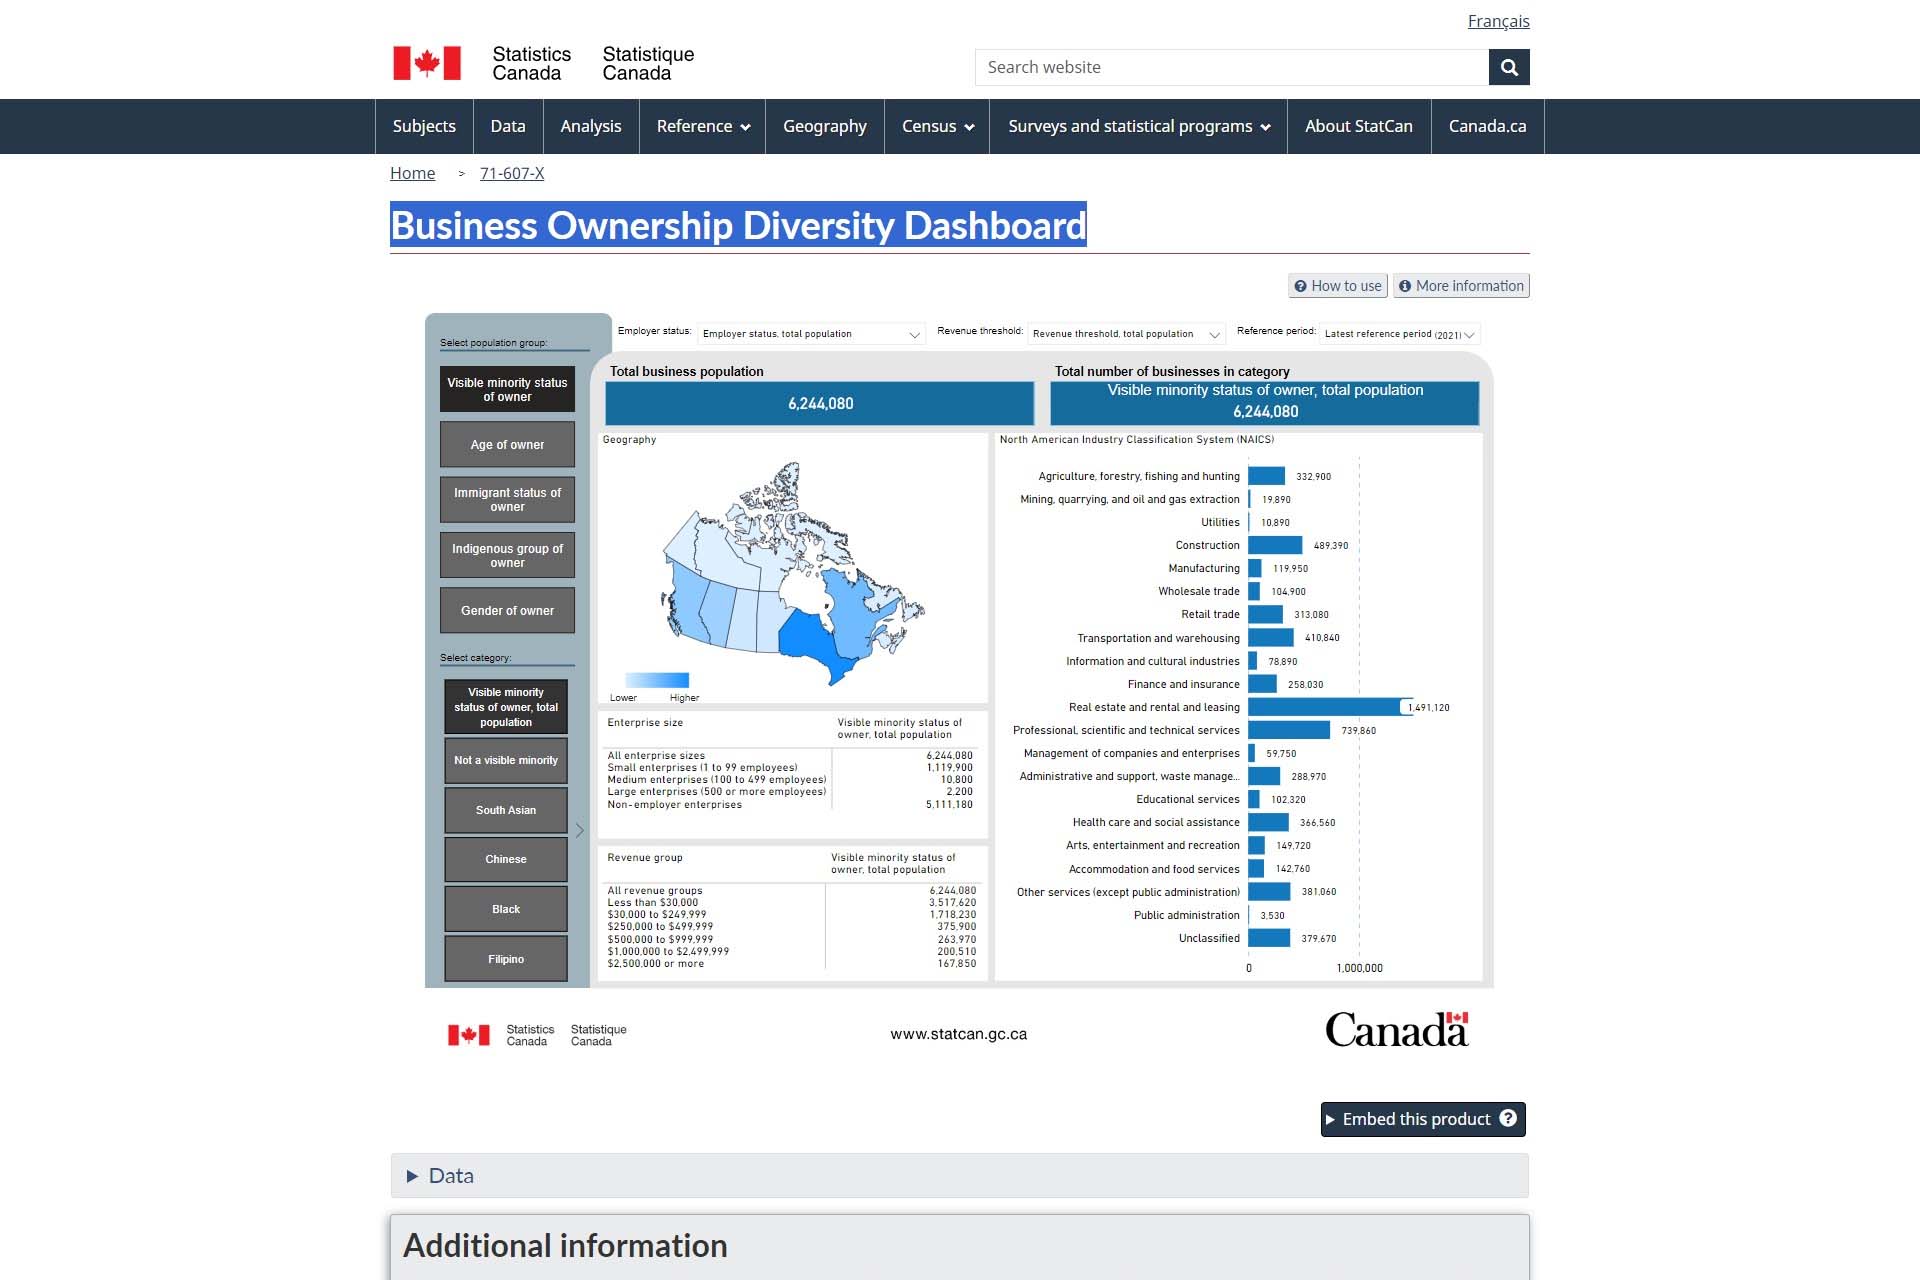
Business Ownership Diversity Dashboard
The “Business Ownership Diversity Dashboard” from Statistics Canada is an interactive tool that provides insights into the distribution of businesses across Canada, segmented by various diversity indicators such as visible minority status, age, immigrant status, Indigenous group, and gender of business owners. This dashboard allows users to analyze business demographics based on location, revenue size, business size (number of employees), and industry sector. Such detailed information is crucial for policymakers, researchers, and business communities to understand the landscape of business ownership diversity, identify gaps, and develop strategies that promote inclusive economic growth.
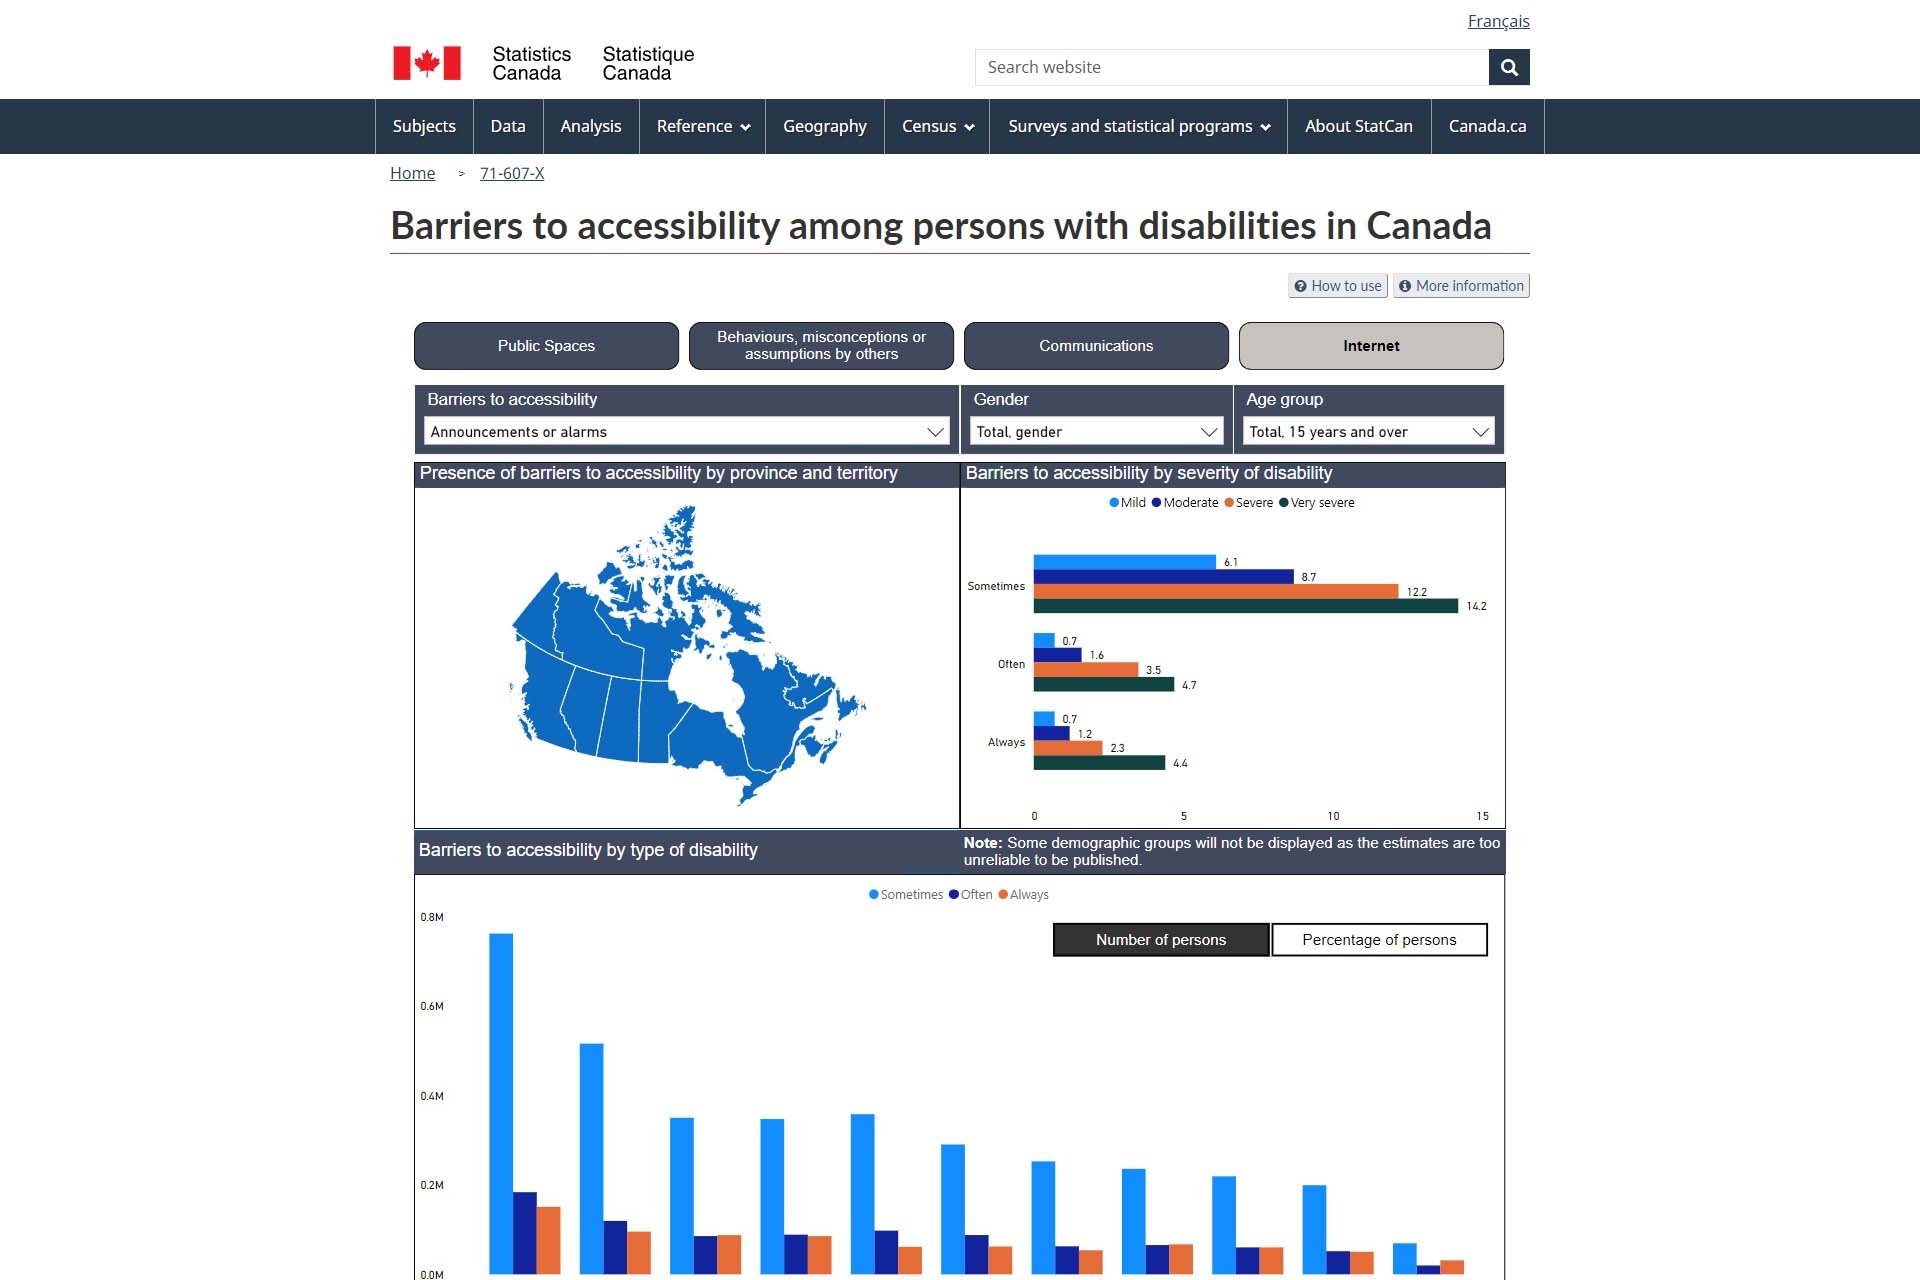
Barriers to accessibility among persons with disabilities in Canada
The “Barriers to Accessibility Among Persons with Disabilities in Canada” interactive dashboard, published by Statistics Canada, offers comprehensive data on the obstacles faced by individuals with disabilities in various aspects of daily life. Drawing from the 2022 Canadian Survey on Disability, this tool examines 27 types of accessibility barriers encountered in public spaces, communication, internet usage, and societal behaviors or misconceptions. Users can filter information by province,
Author
-

Mahjabeen Mamoon is the Senior Manager of Research at Toronto Workforce Innovation Group.
View all posts